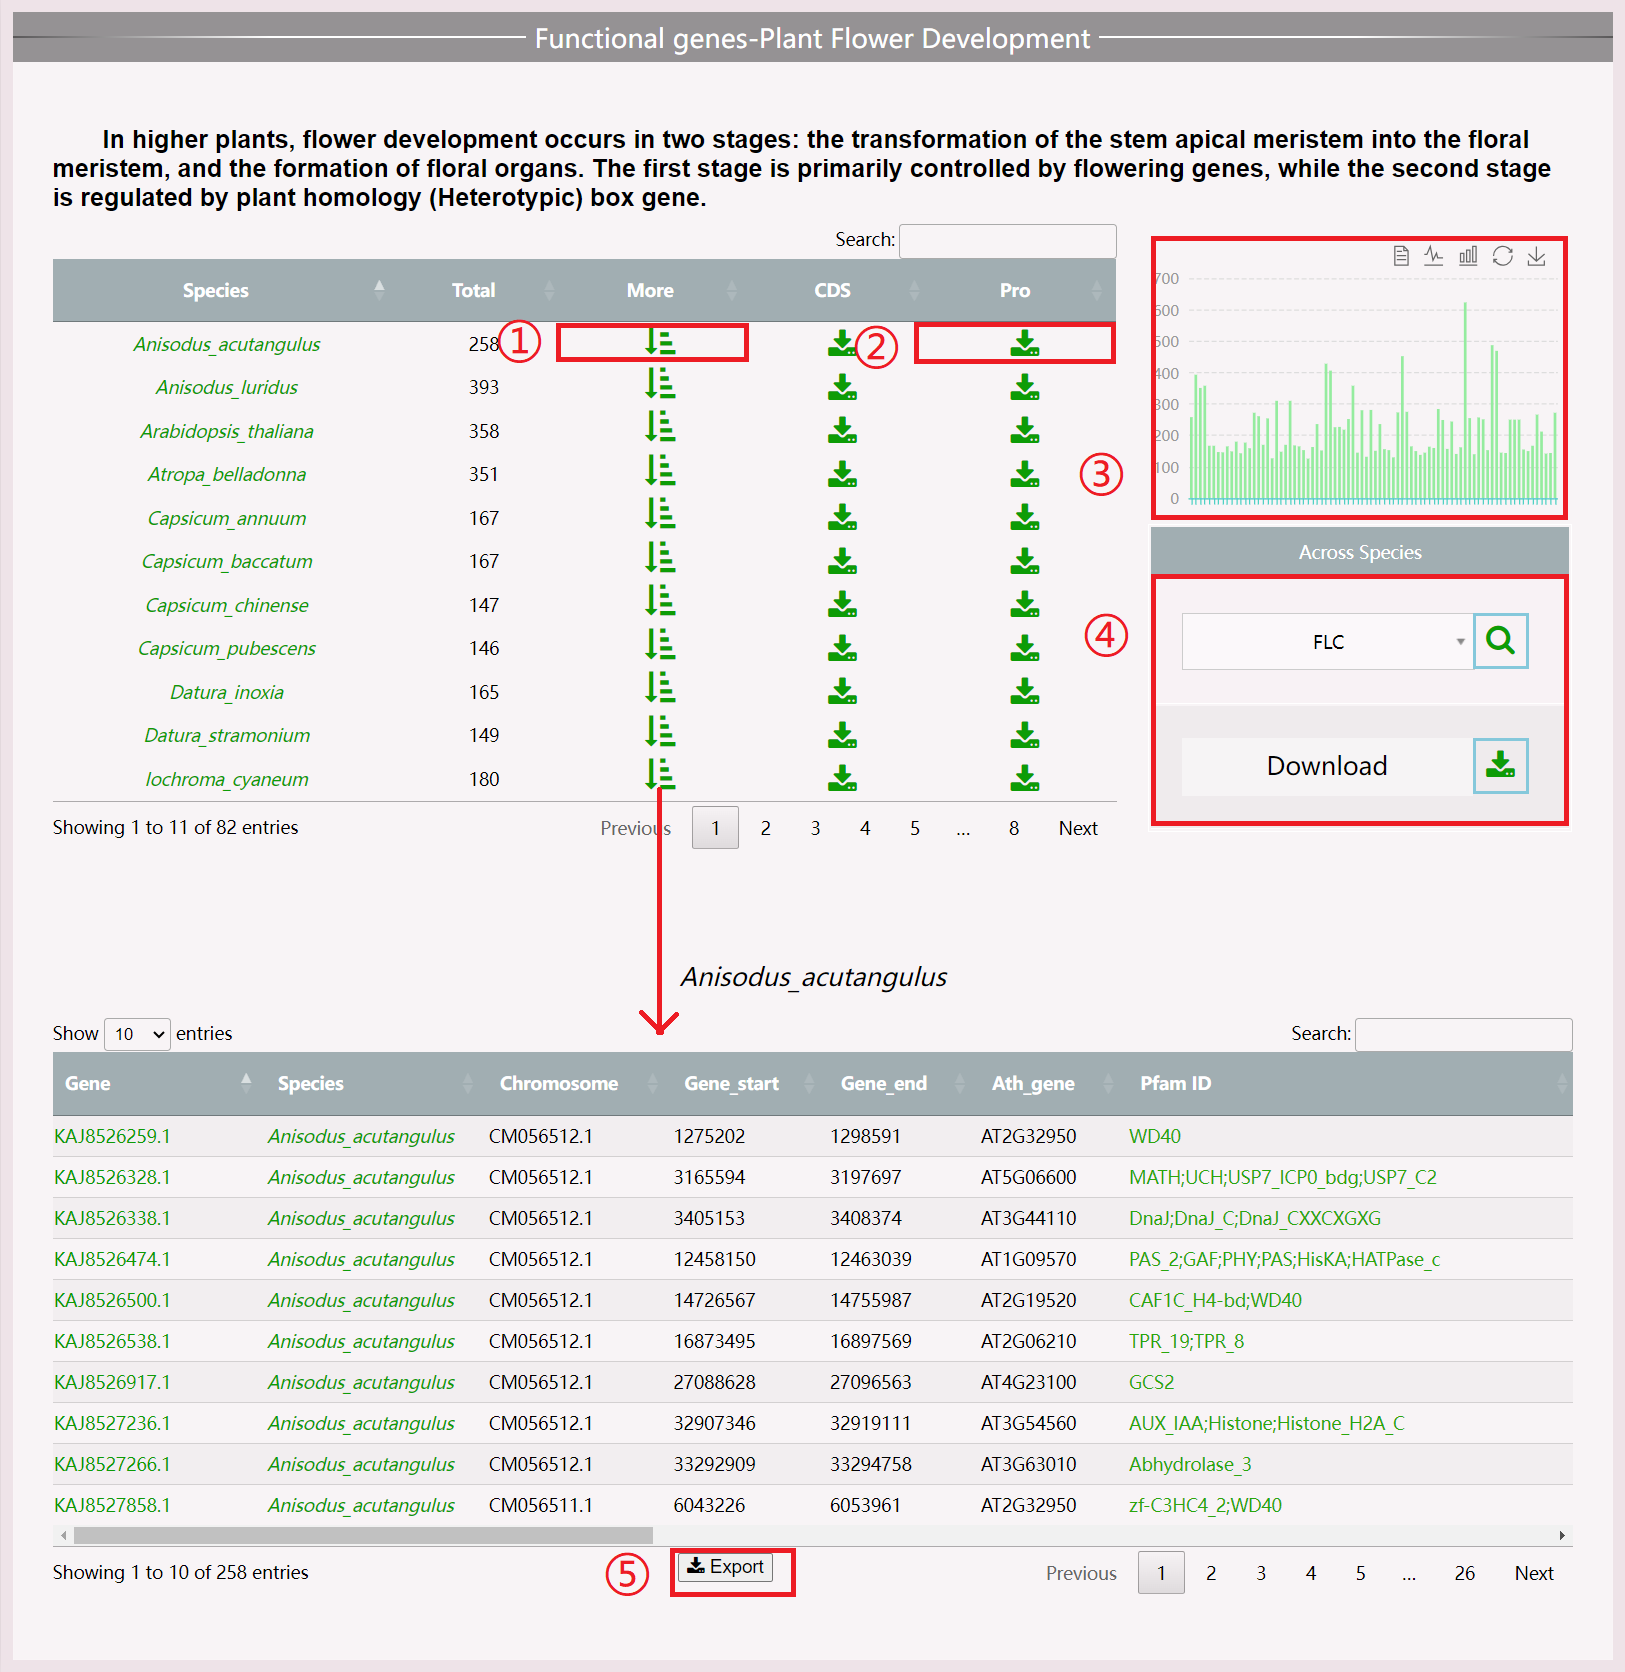
(1) Click the “More” button to obtain information about the functional gene of this species.
(2) Click the “Download” button to download all the protein files of this species related to this functional gene.
(3) View the number of genes in all species in the chart area, and click to view information about the functional genes of that species.
(4) Perform across species search for functional genes by clicking “Search” to view information and “Download” to obtain gene sequences of all species.
(5) Download results in .xls format.
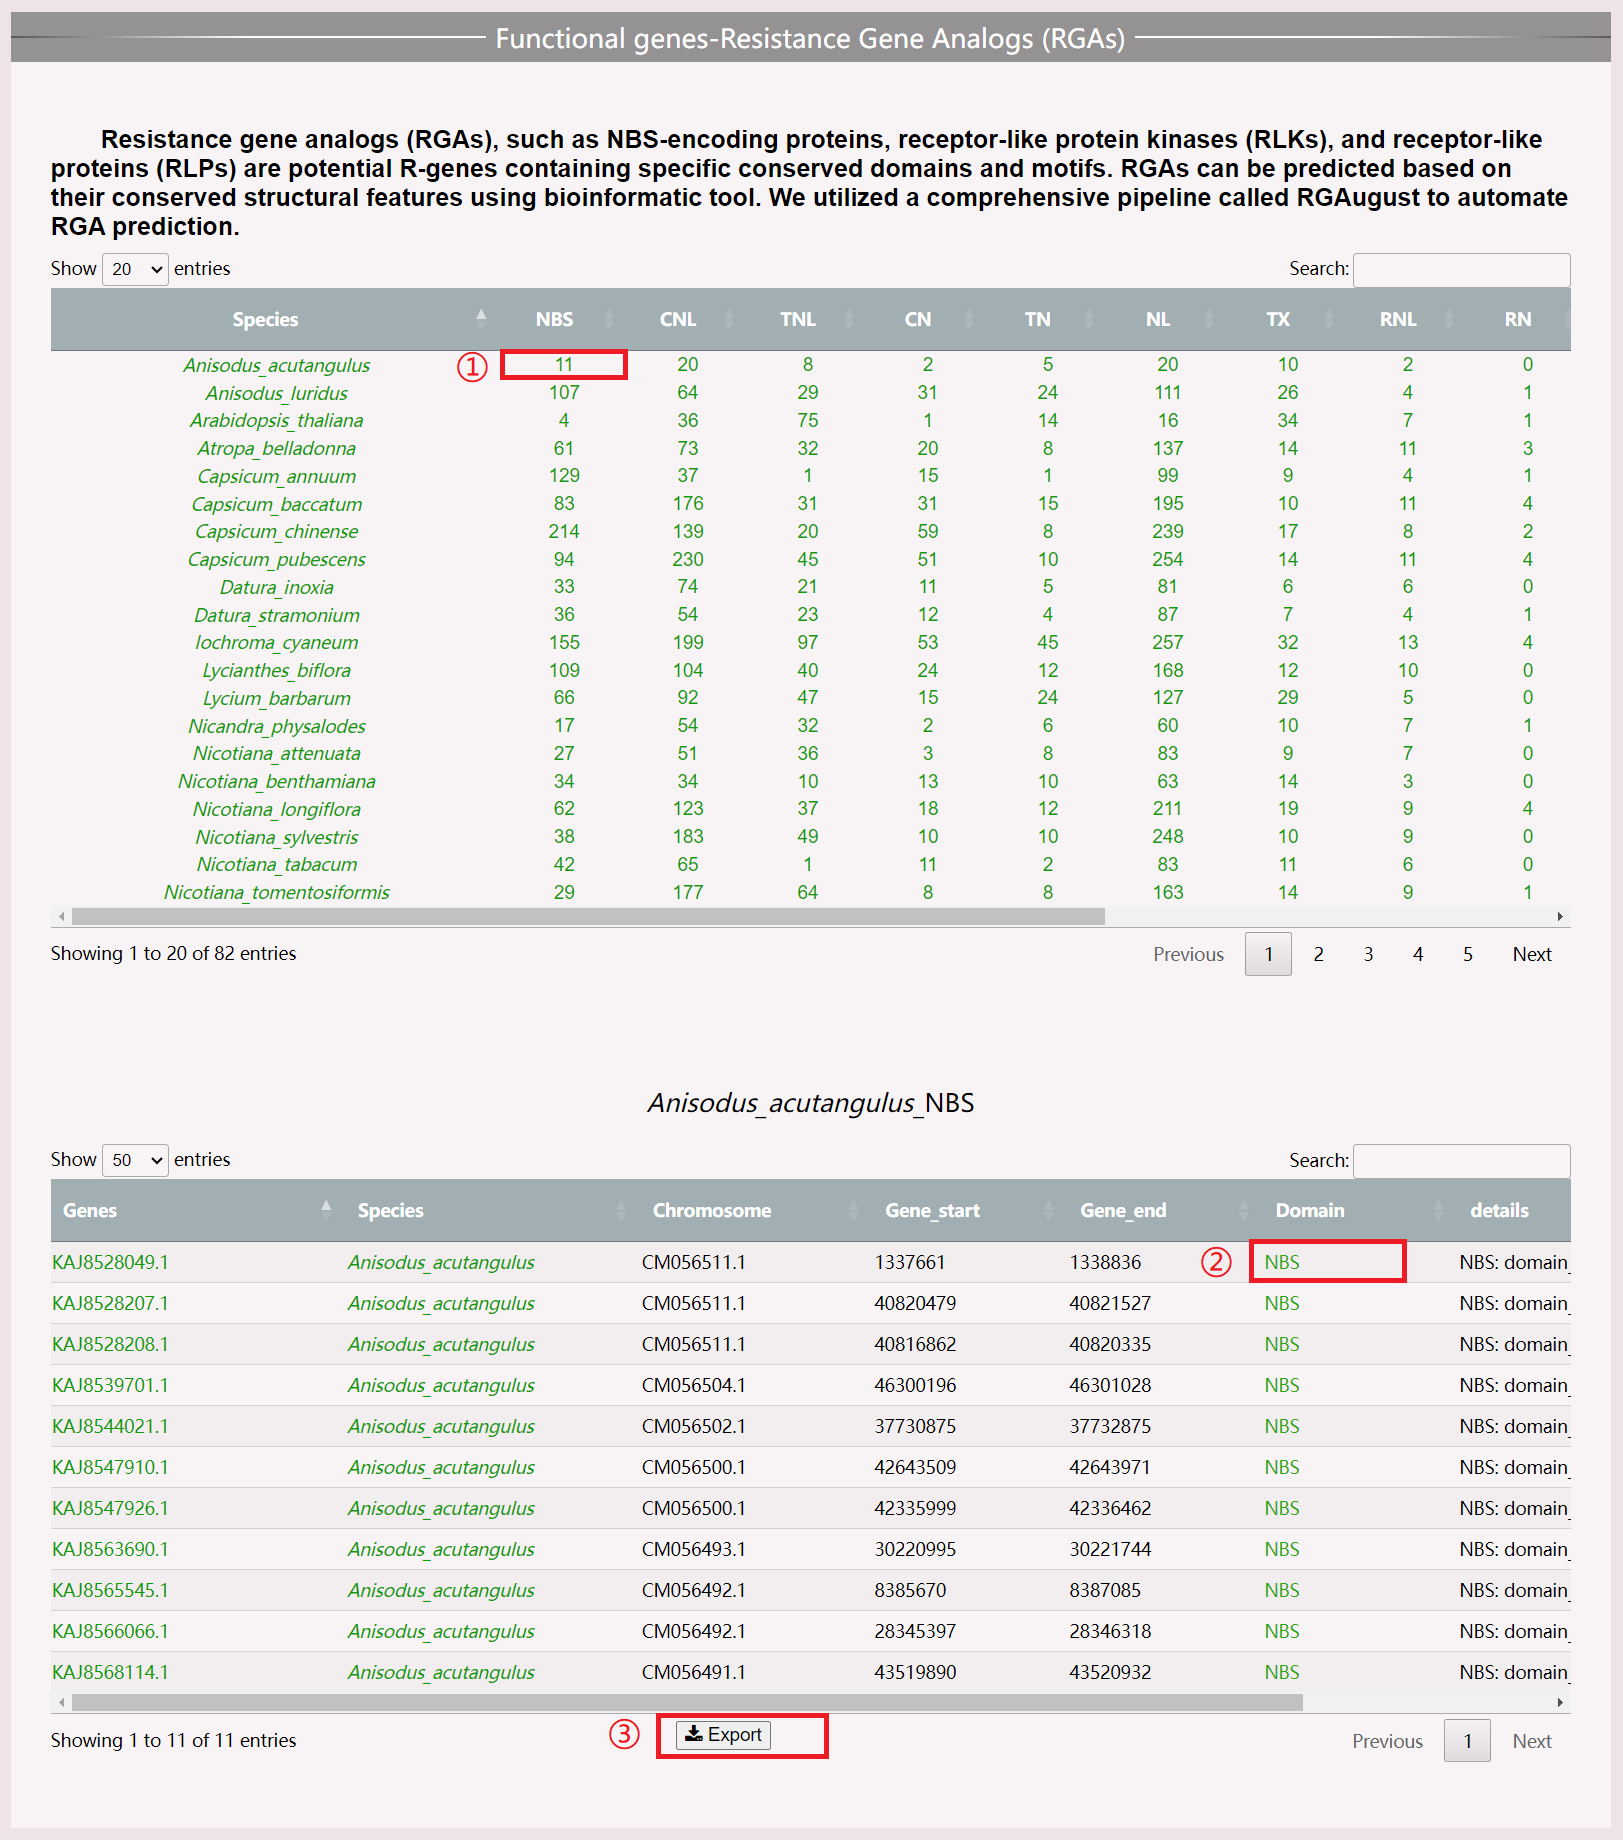
(1) Click on specific numbers to view the genetic information of resistance genes in a certain species.
(2) Download results in .xls format.
(3) Move the mouse to view the position of each segmented structural domain.
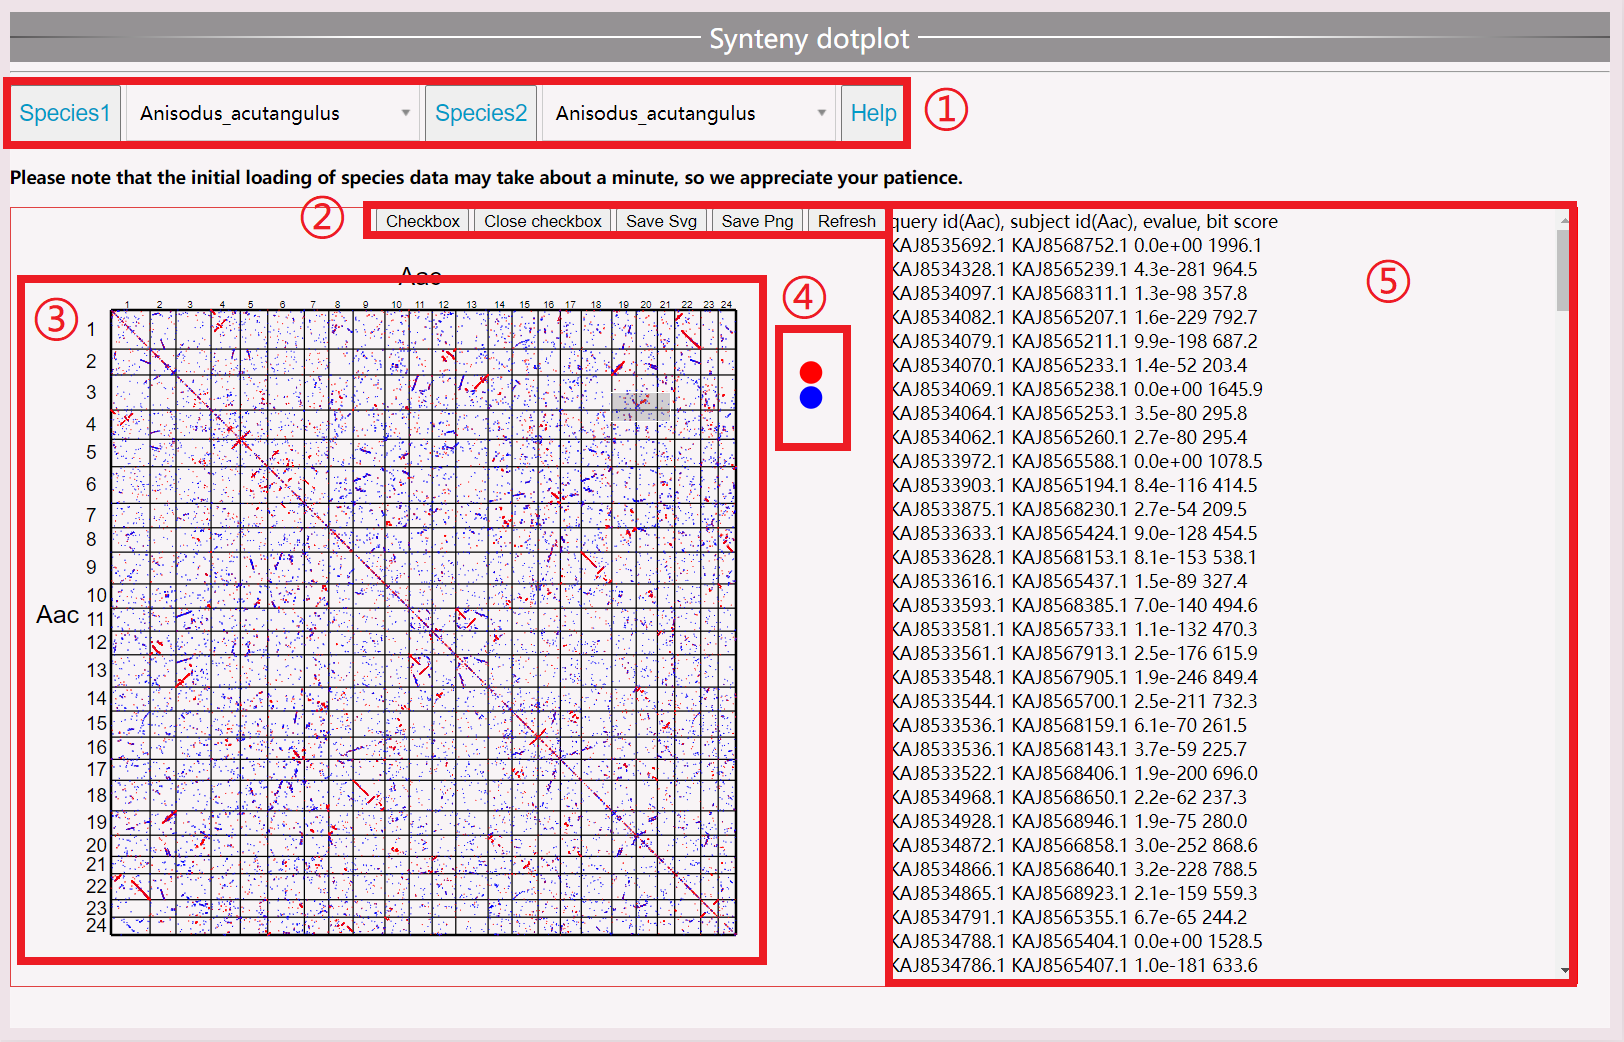
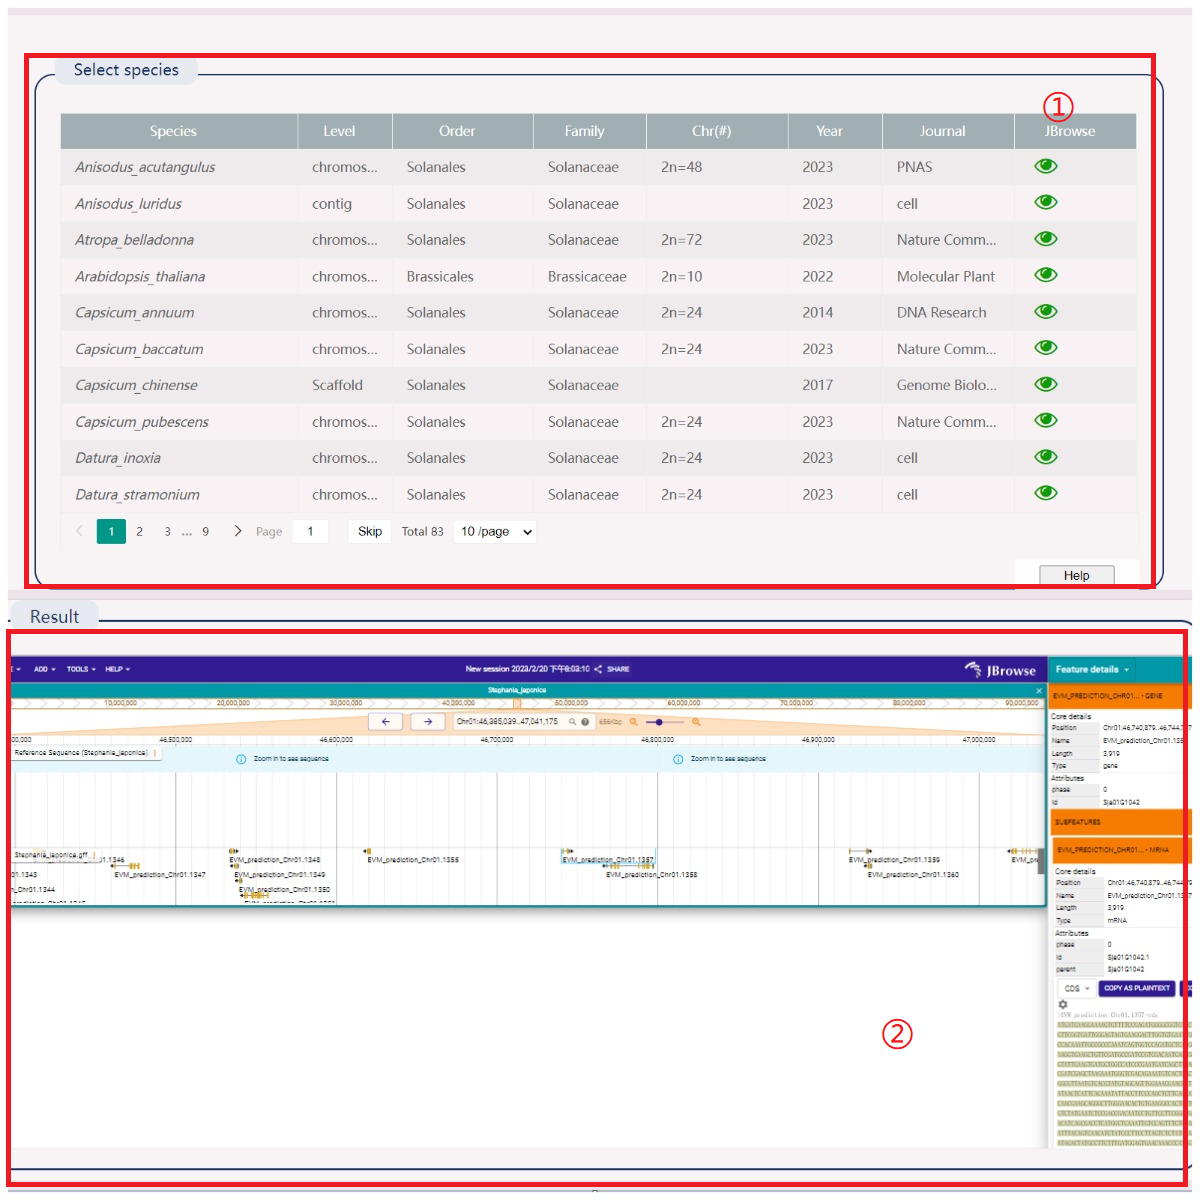
(1) Select the species you want to view; the first loading takes approximately one minute. Do not select other species during the loading process.
(2) Open the selection box to display the gene ID in the right. Save the selection in SVG or PNG format or refresh the view.
(3) View the point map between species genes.
(4) Red represents the best-matched gene, blue represents the second best-matched gene. Click to toggle display.
(5) View species synteny gene pairs, including gene ID, evaluation value, and bit score value.
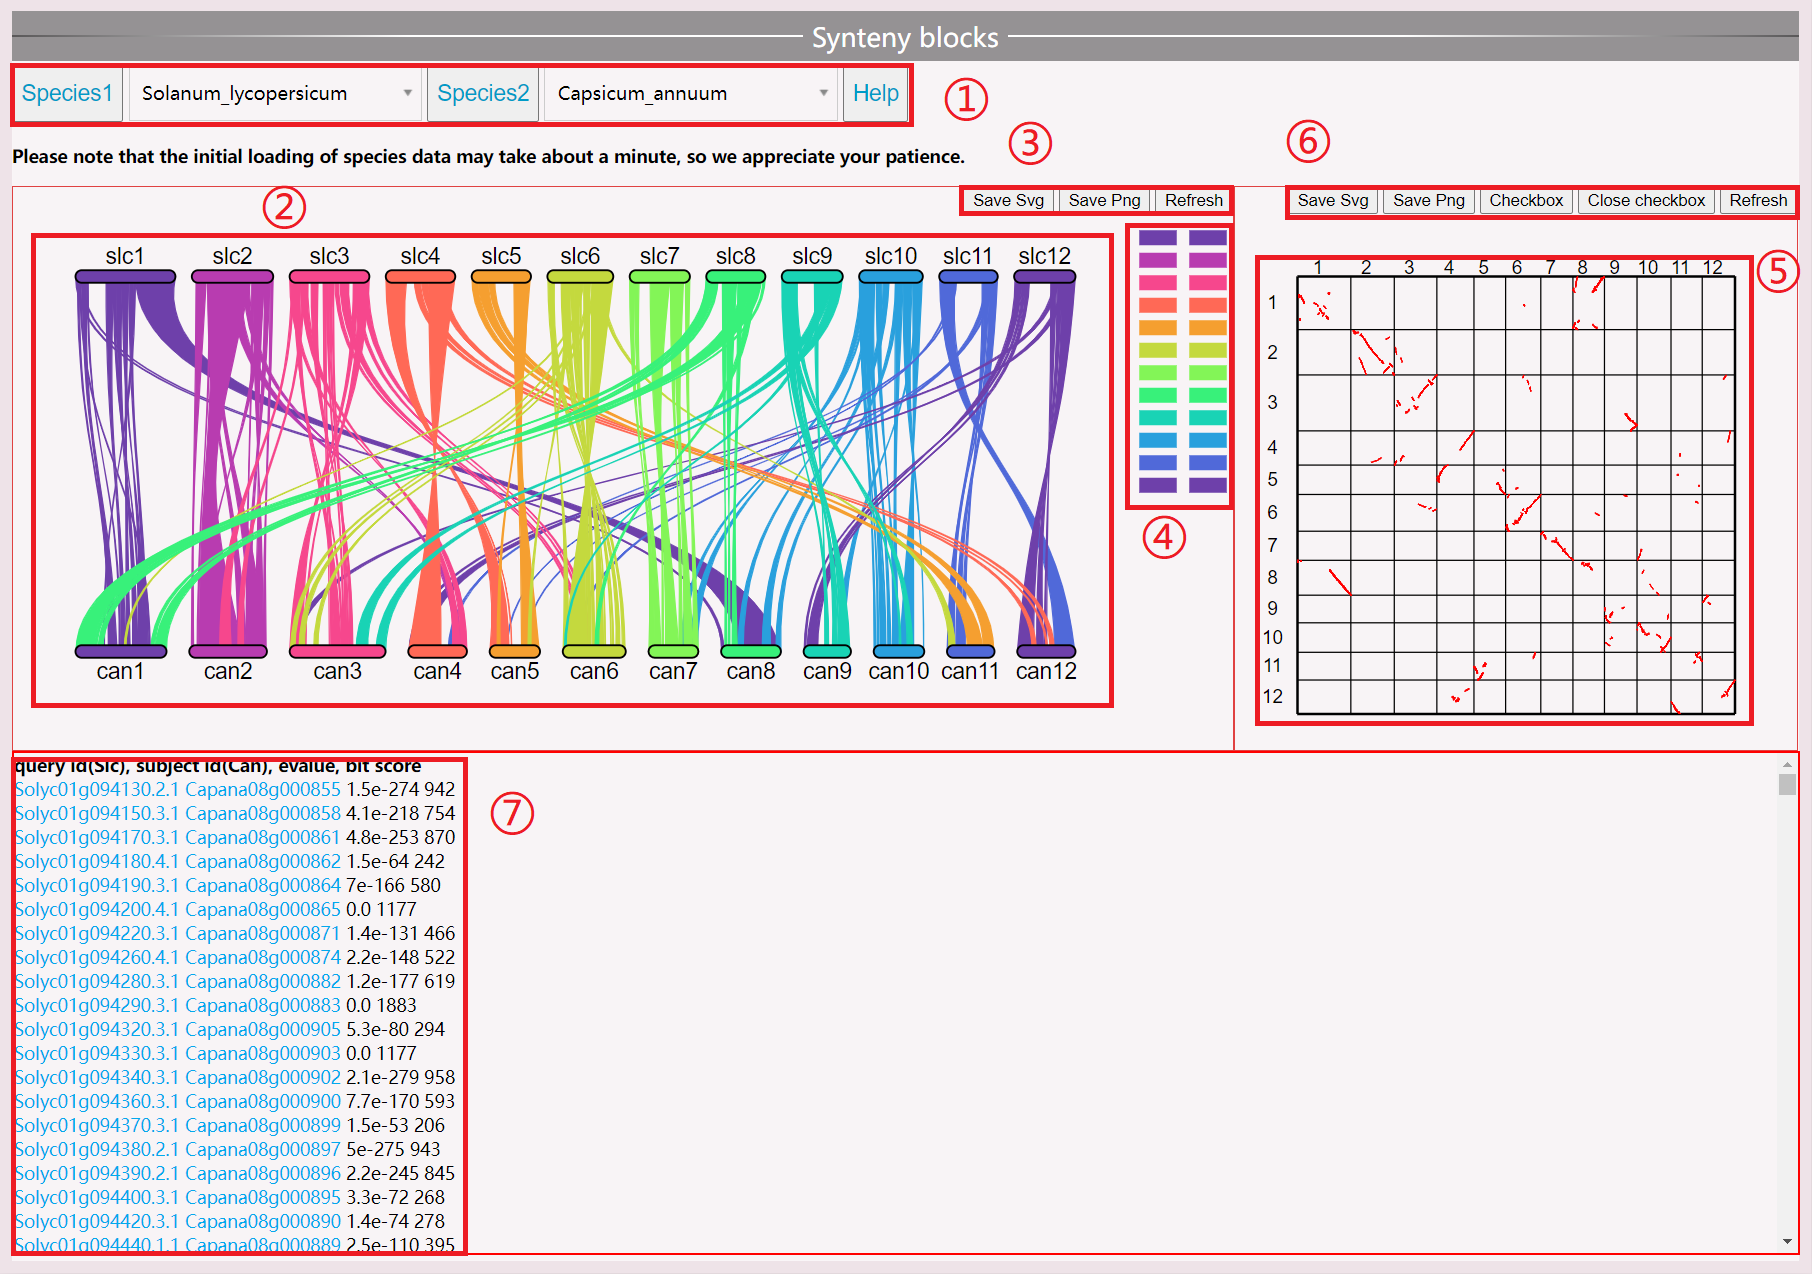
(1) Select the species you want to view; the first loading takes approximately one minute. Do not select other species during the loading process.
(2) View the synteny map between species chromosomes. Click on a line segment to view specific genes. Moving the mouse will turn the corresponding segment green.
(3) Save and reload images.
(4) Click on the left chromosome can mask it.
(5) Click on a point in the species synteny gene map to view specific gene information.
(6) Open the selection box to display the gene ID. Save the selection in SVG or PNG format or refresh the view.
(1) Click the “More” button to obtain information about the functional gene of this species.
(2) Click “All Families” to view all transcription factors of the species.
(3) Click the “Download” button to download all protein files related to this functional gene.
(4) Perform across-species searches for transcription factors.
(5) View a columnar statistical chart of all transcription factors of a species.
(6) View the result table, with detailed descriptions displayed when the mouse is moved over the Pfam ID.
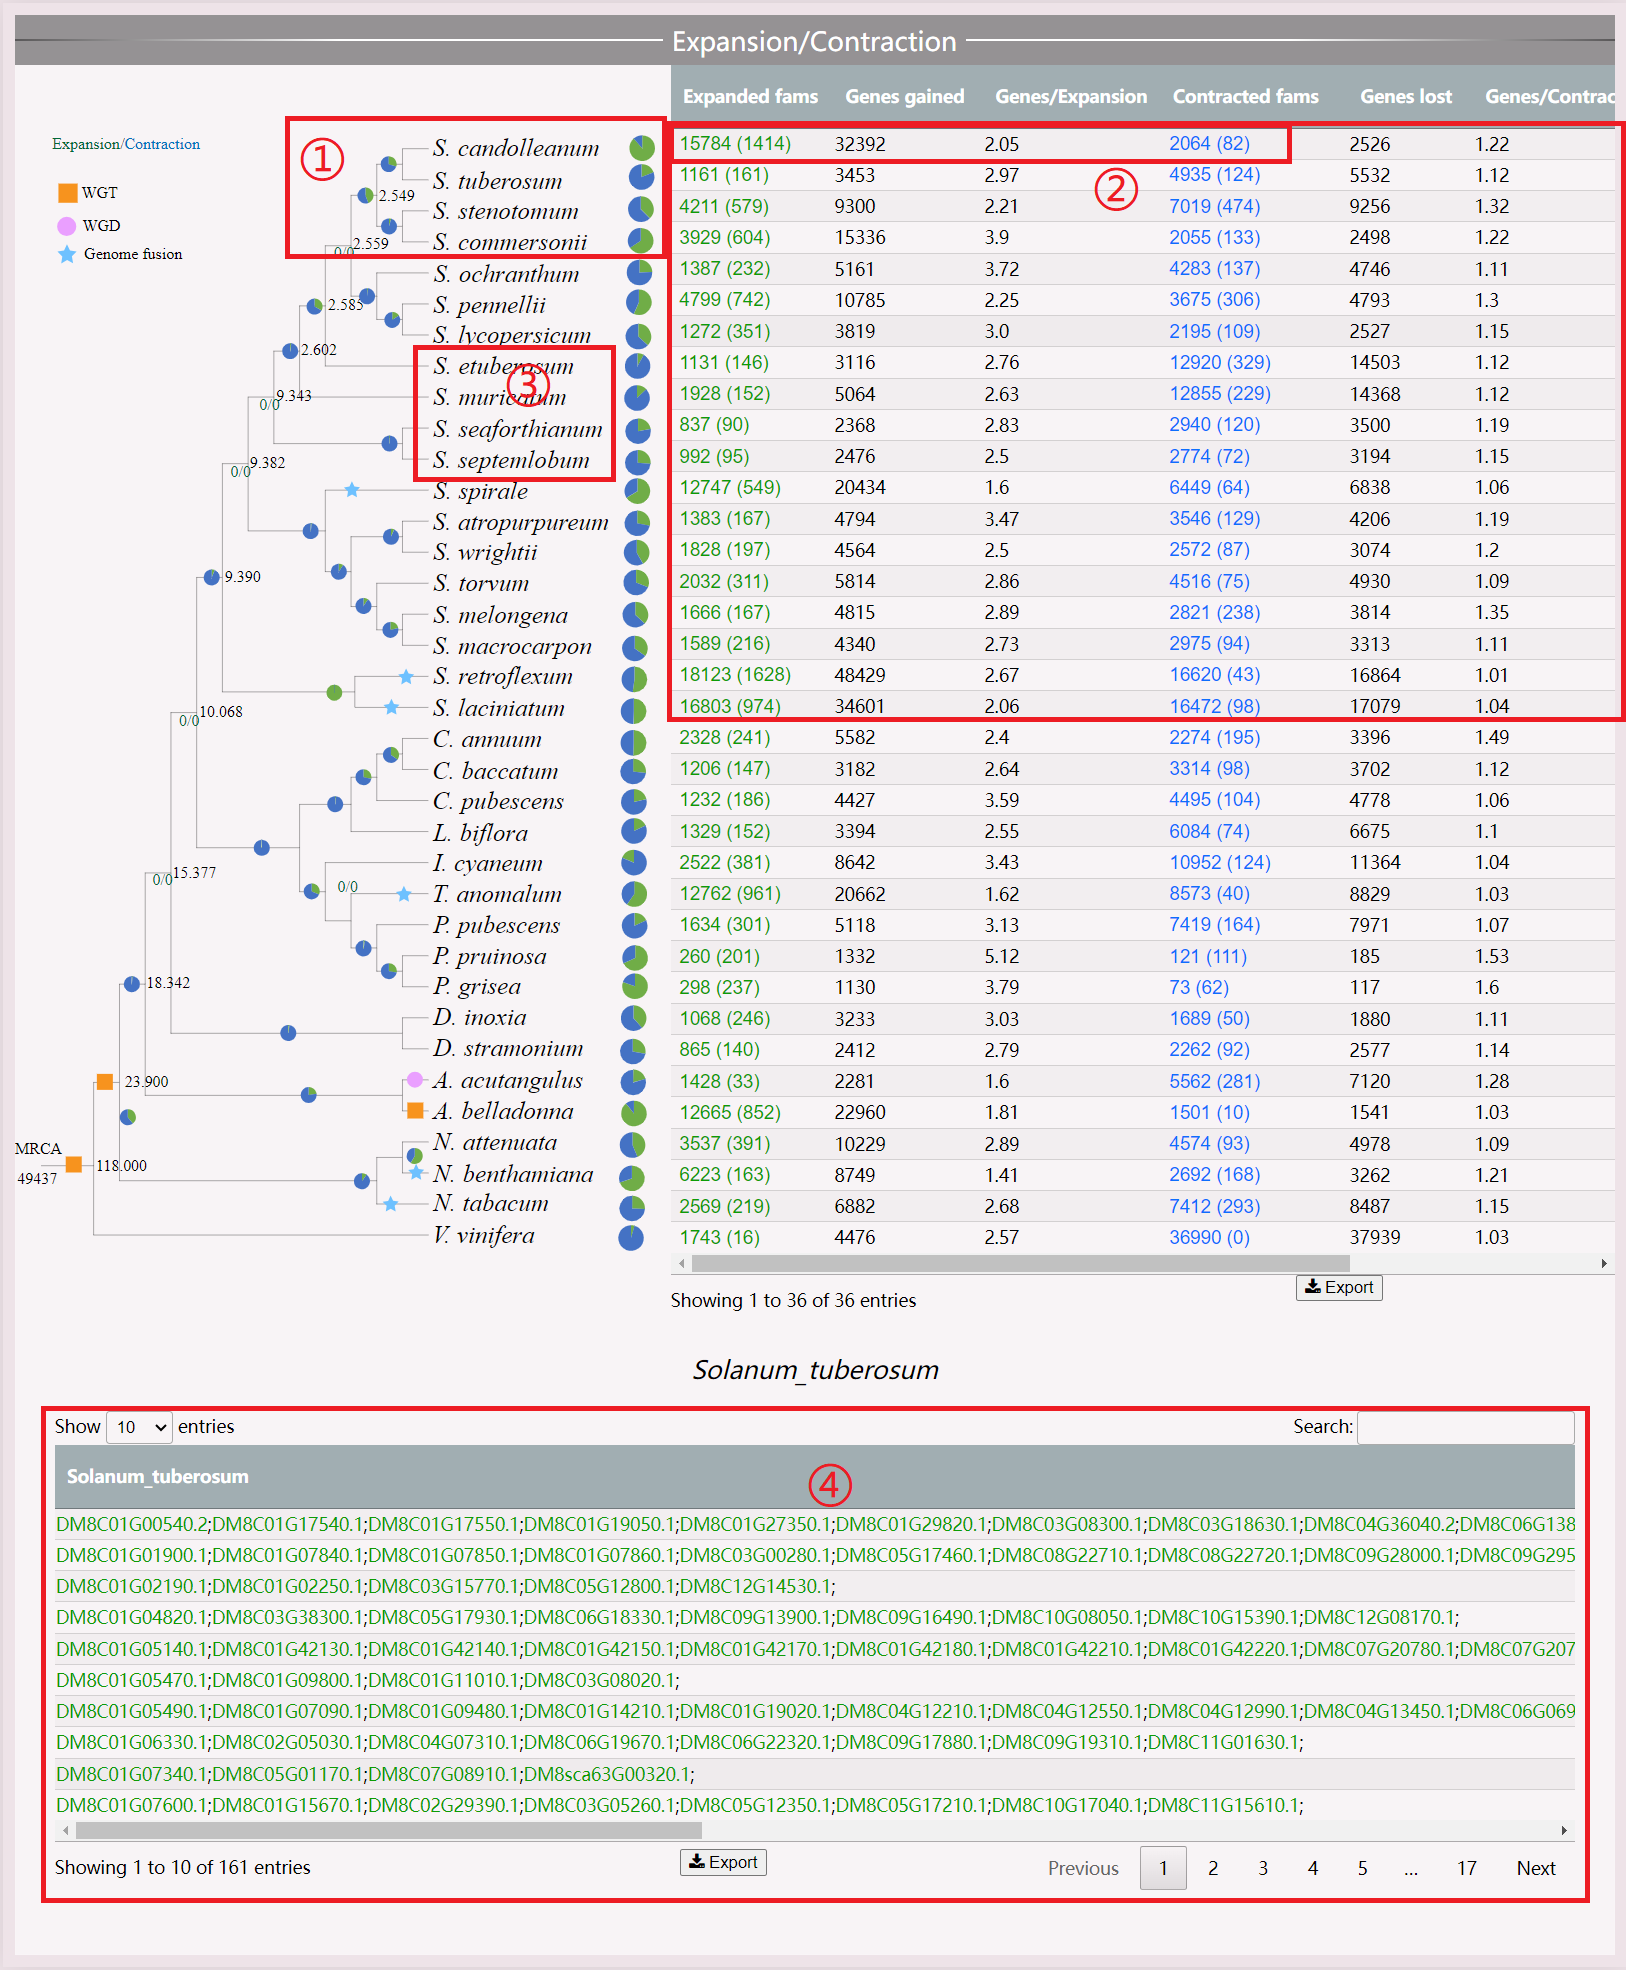
(1) Move the mouse over the pie chart to display the number of genes involved in expansion and contraction. Click to view specific genes.
(2) View all genes and the ratio of genes to expansion genes by clicking the numbers.
(3) Click on the species to jump to the species interface.
(4) View the gene results of expansion and contraction, and click to jump to the gene interface.

(1) Access related articles and data download addresses.
(2) Submit the pan-genomic data you want to display.
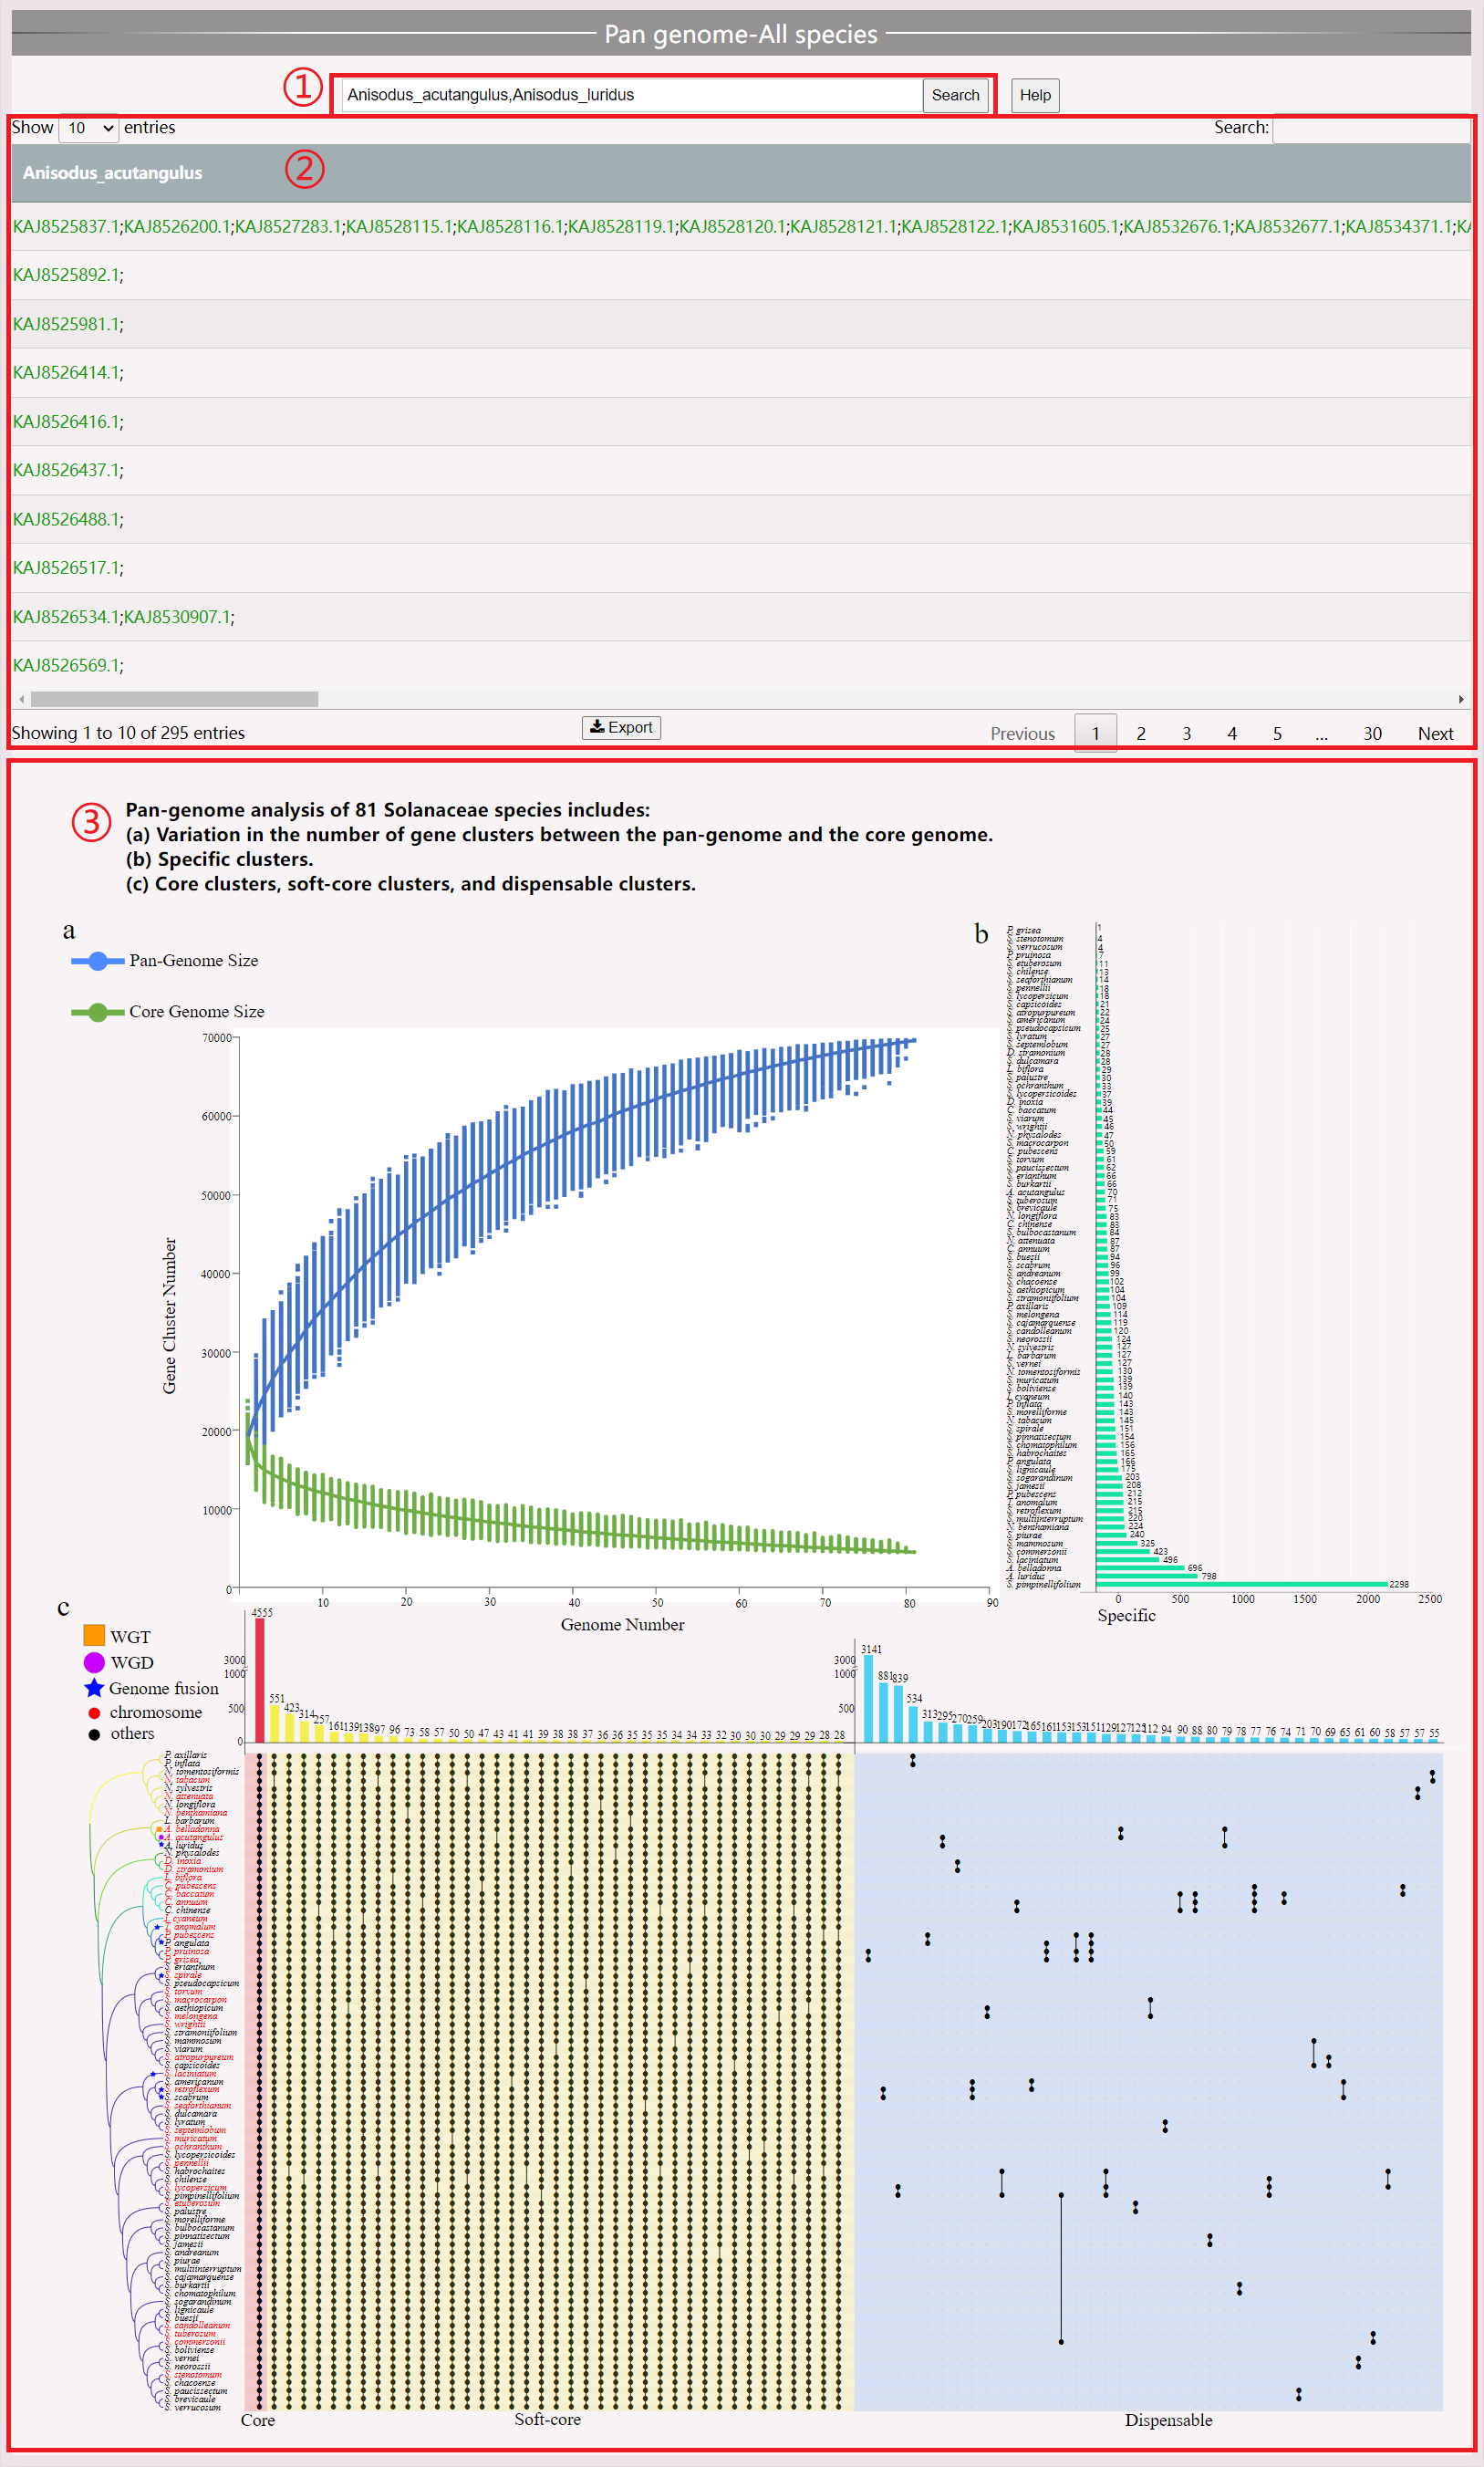
(1) Select the species you want to view.
(2) View the gene family of the selected species.
(3) Pan-genome analysis of Solanaceae to help users view results at an overall level.
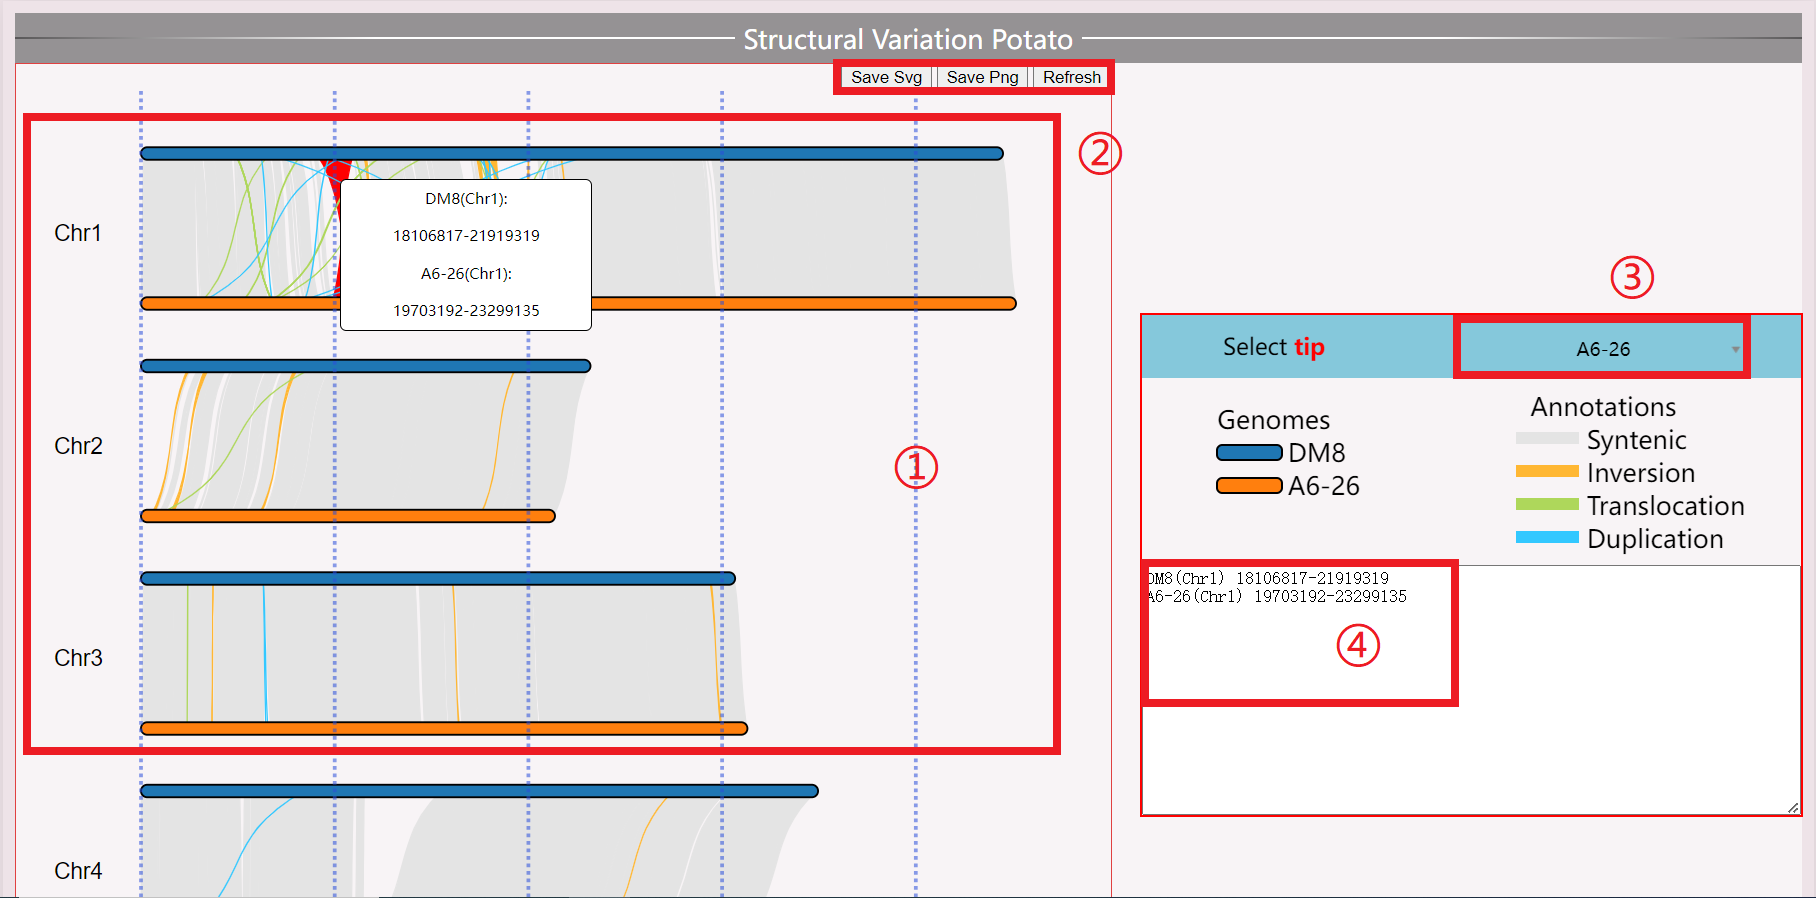
(1) Display chromosomal structural variations.
(2) Save and Reload data.
(3) Switch between displayed samples.
(4) Click on specific segments to display detailed location information.
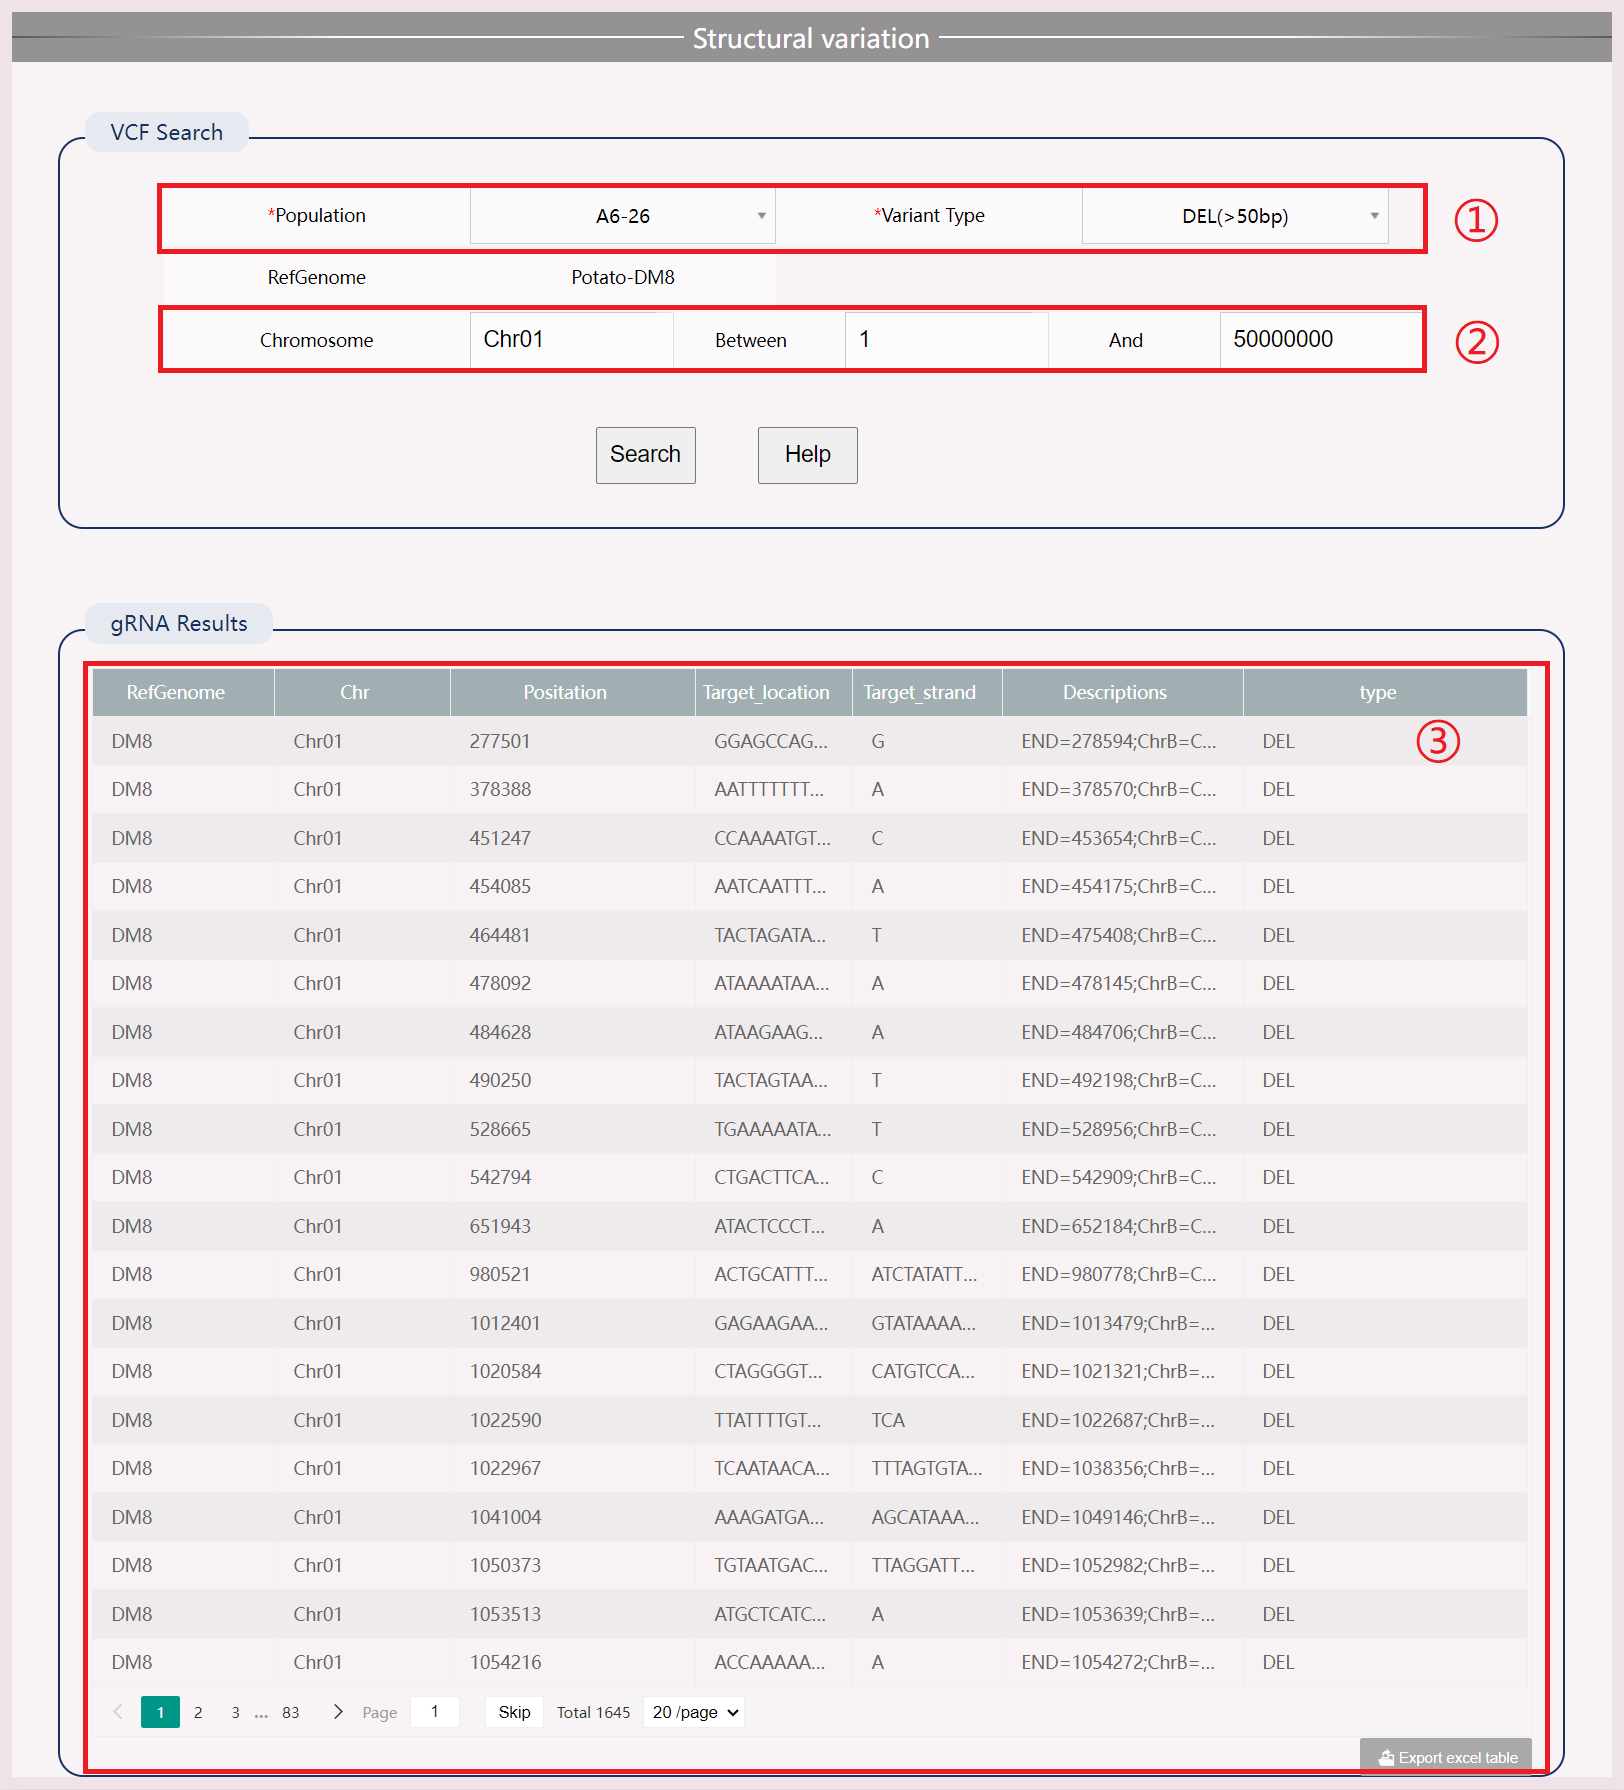
(1) Select the samples and compilation types you want to view.
(2) Input chromosome numbers and start/end positions to increase query speed.
(3) View and download results.
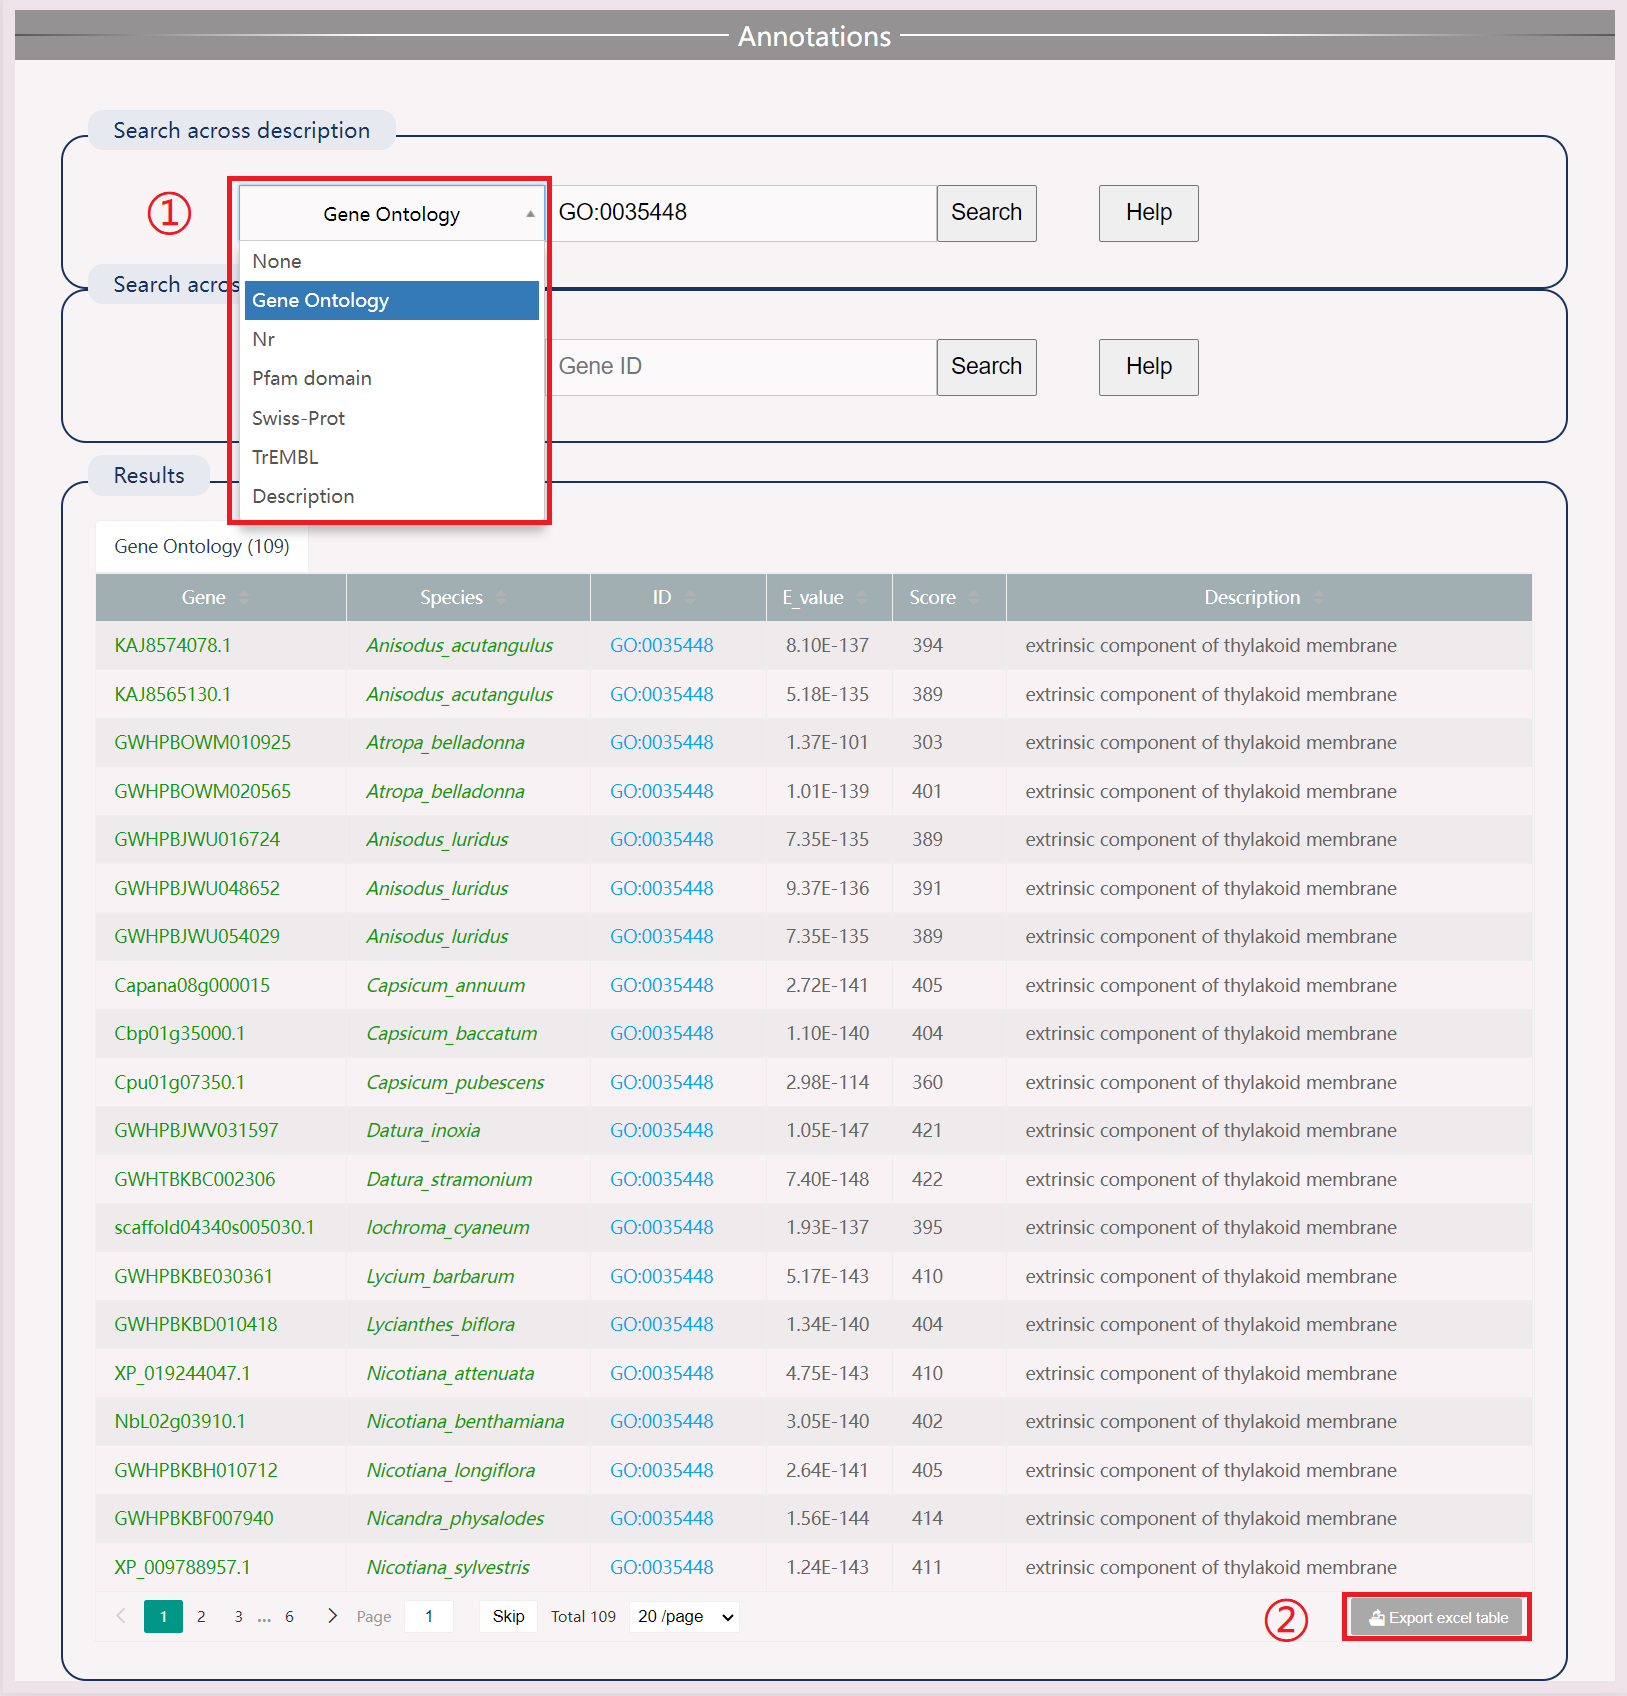
(1) Search by species name and gene ID in four protein databases: Swiss Prot, TrEMBL, Nr, Pfam, and the GO gene ontology database. Also includes comparison information with Arabidopsis blast. Click the search button to search the results.
(2) Download results in .xls format.
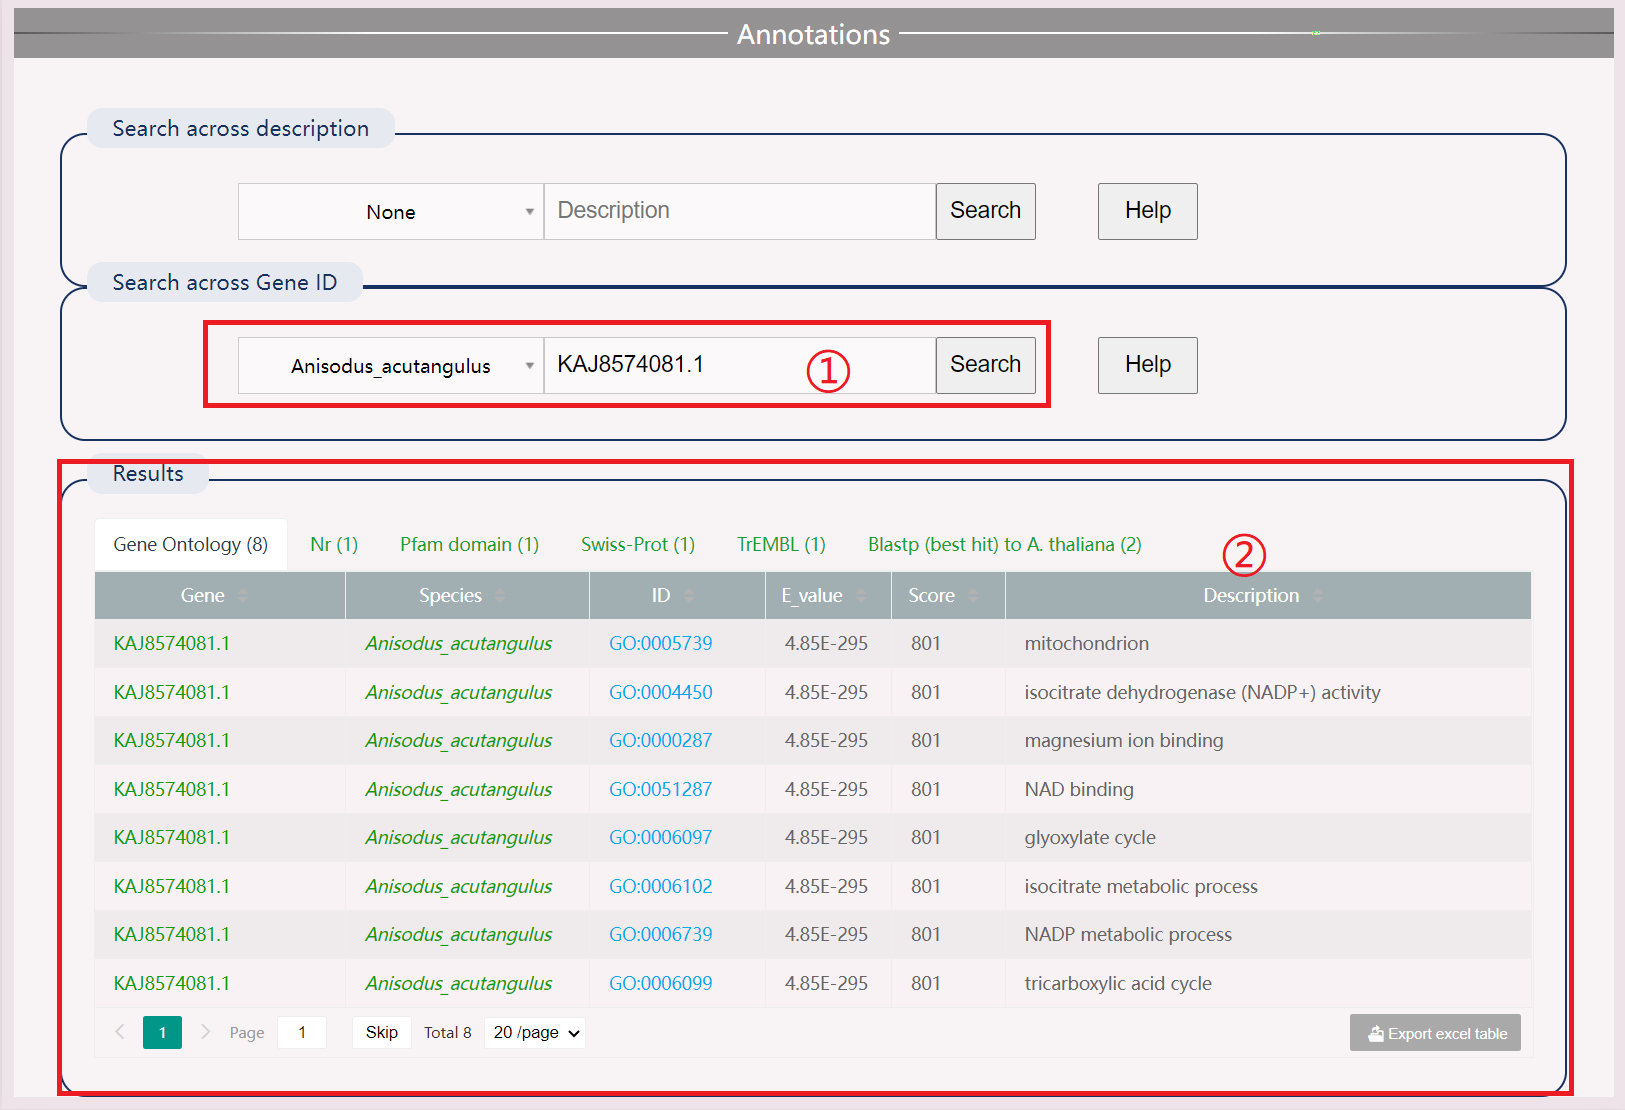
(1) Search by species name and gene ID.
(2) Obtain Results Different description information, including gene ontology, Nr, Pfam, Swiss Prot, TrEMBL, best hit to A. thaliana.

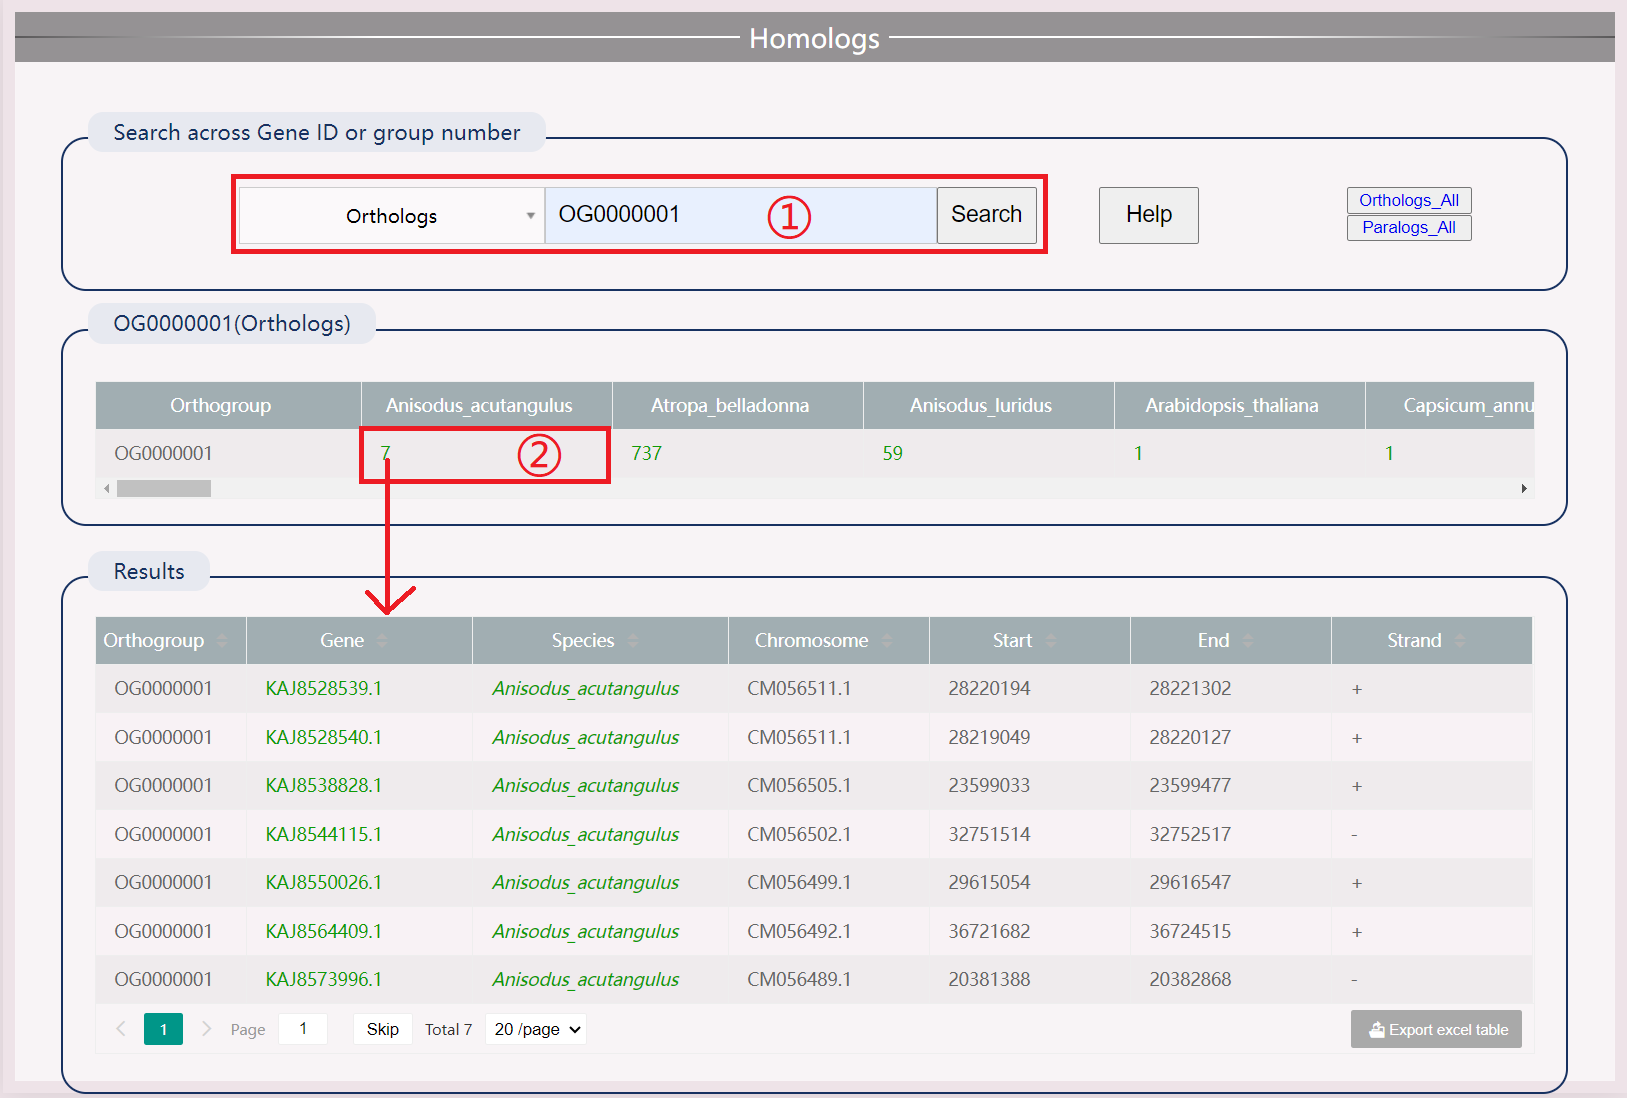
(1) Search by species name and gene ID.
(2) Download orthologous and paralogous genes by clicking "Orthologs_All" and "Paralogs_All".
(3) Click the specific number to view the gene of this species in this orthogroup. The searched gene will be highlighted.
(4) Search by orthogroups.
(5) Click the specific number to view all gene information in the orthogroups.

(1) View randomly selected genes of various species.
(2) Select the length of the frank fragment.
(3) Freely select the genome you want to compare with the selected gene.
(4) View the synteny relationship of the reference species chromosome internally and the synteny loop diagram of the selected species externally. Click on a synteny block to view synteny genes in this section.
(5) View gene retention values of species synteny genes relative to the reference species. Move the mouse over to display the specific gene, and click to search for the gene.
(6) View the gene synteny table, displaying synteny genes before and after searching based on flank values.
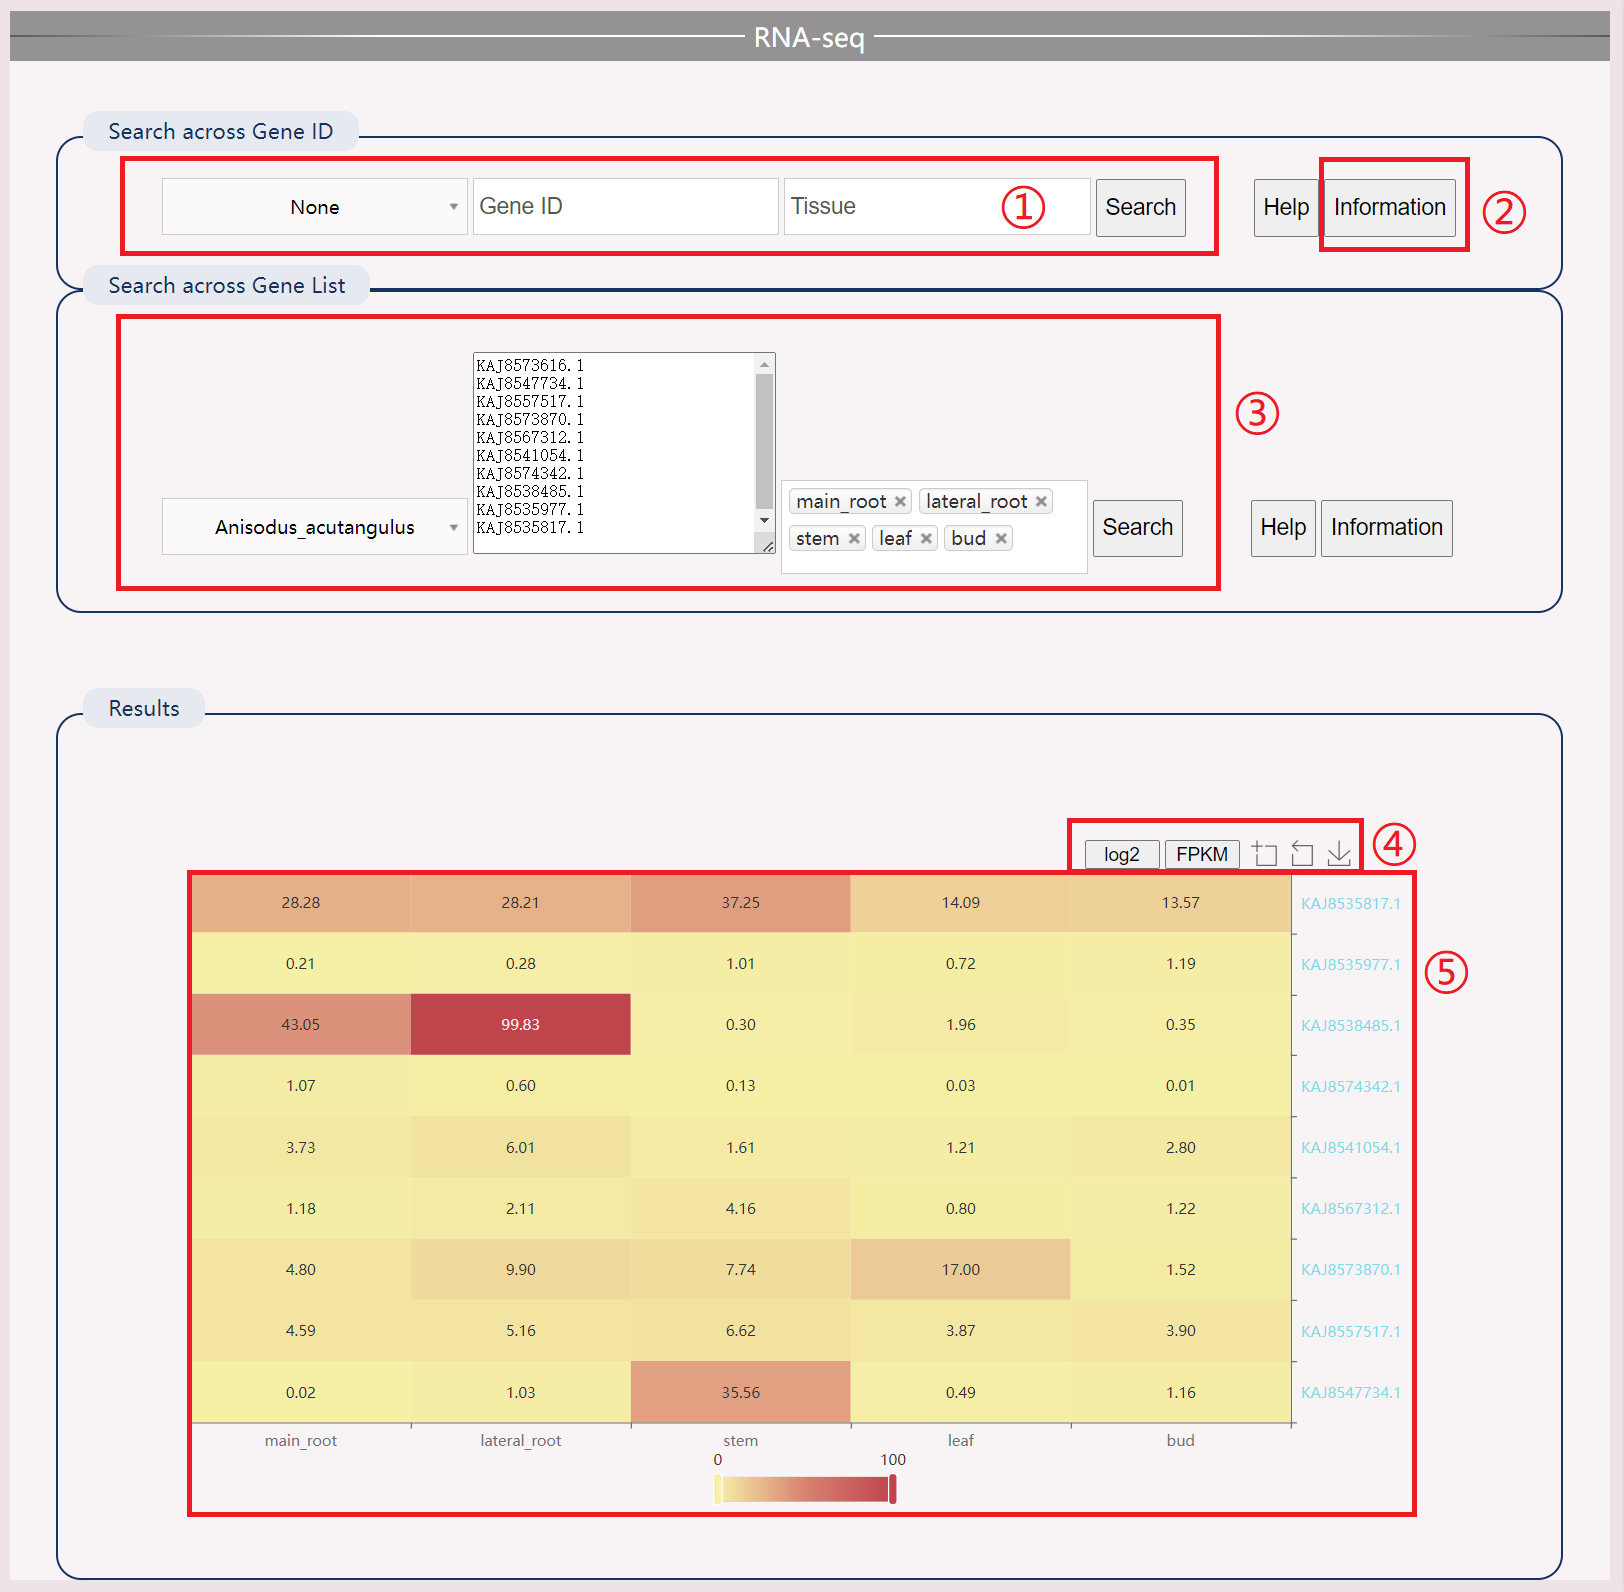
(1) Enter the gene name and tissue name of the species to display the top ten genes through user input.
(2) Download detailed transcriptome information for species.
(3) You can also provide a list of genes.
(4) Obtain logarithmic results.
(5) View a heat map of gene expression in tissues.
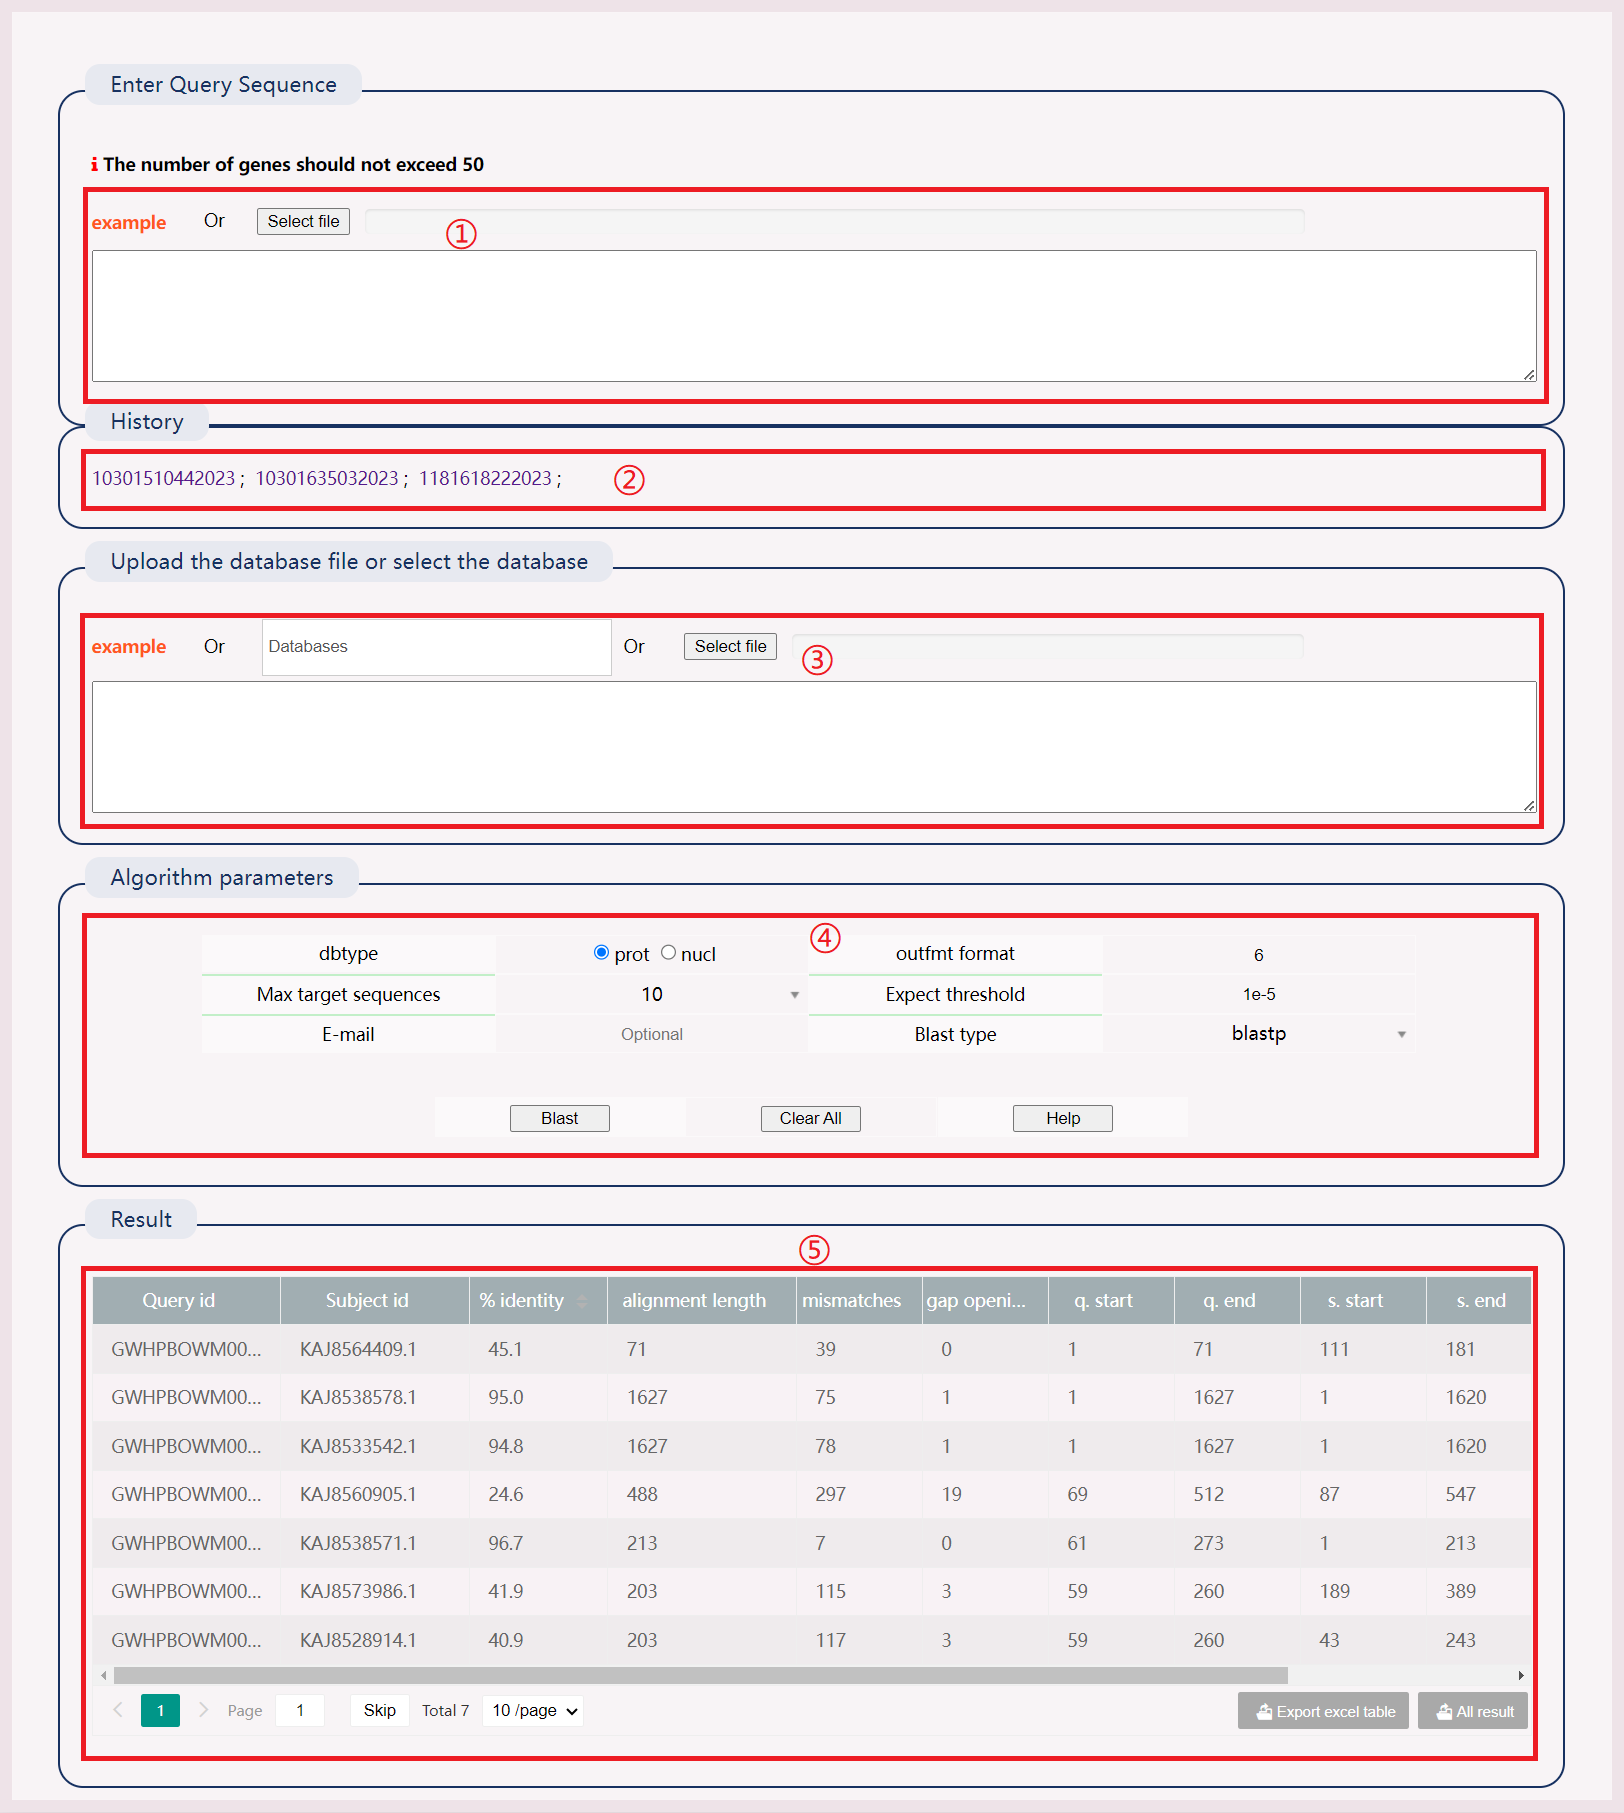
(1) Enter the FASTA sequence to be BLAST-aligned or submit the file.
(2) After successful operation, a history record will be generated. Click the link to view the results directly.
(3) Manually input the database creation file, submit the database creation file, or select a local database or multiple databases simultaneously.
(4) Select "dbtype", "out format", "Max target sequences", "Expect threshold", "Blast type". Enter an email to receive results.
(5) The BLAST result has 12 columns representing various alignment metrics.
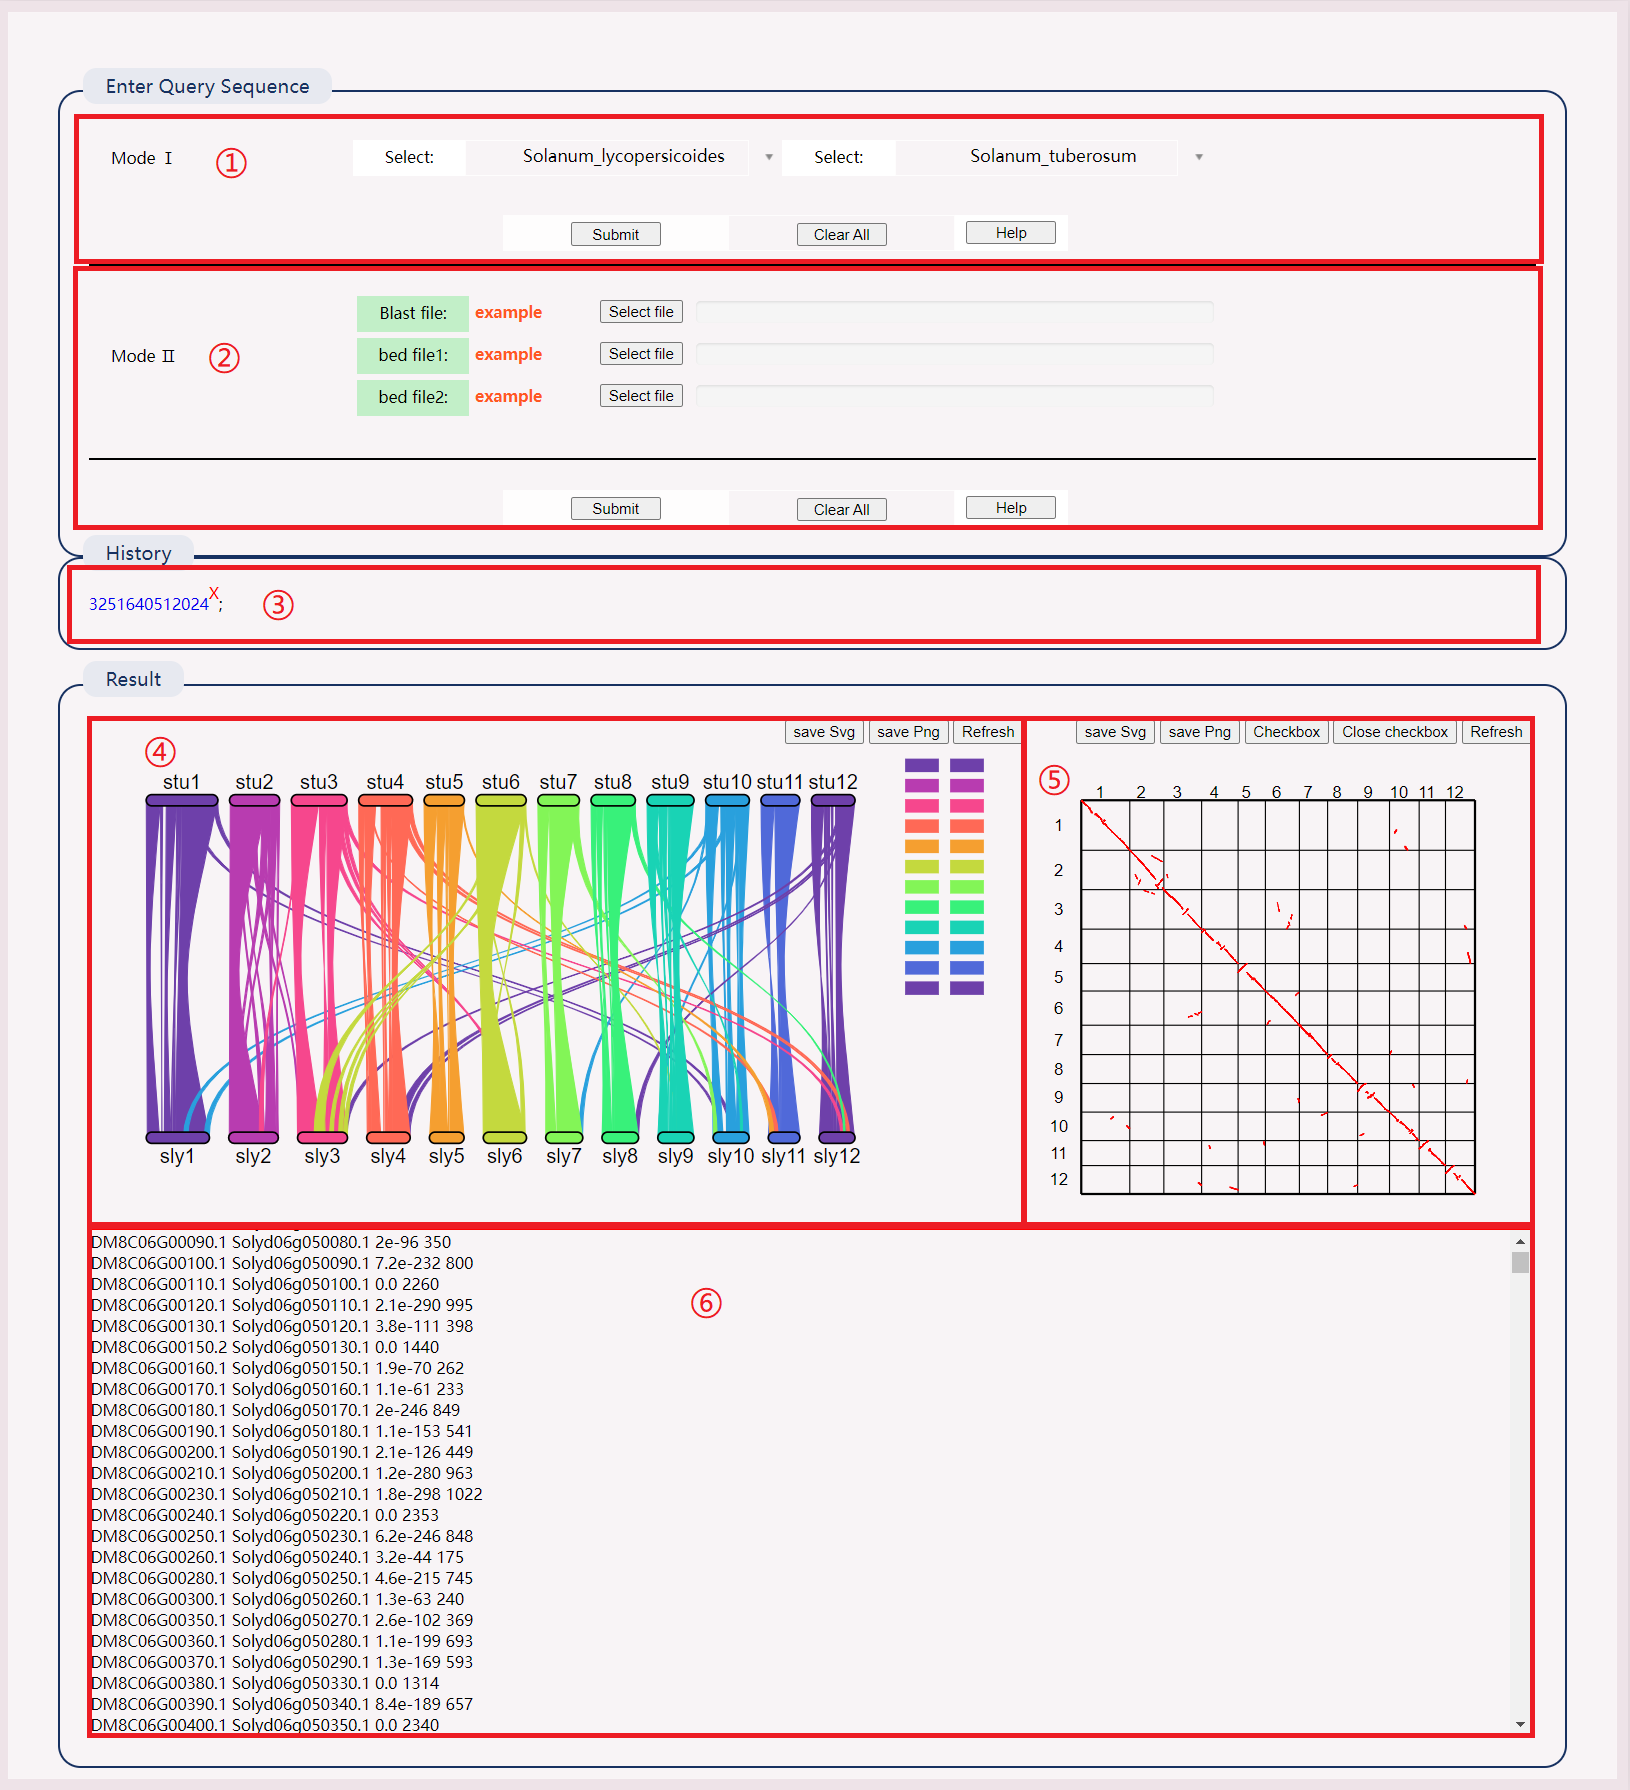
Inspired by Python MCscan:
(1) Select two species to view results directly.
(2) Click on the example to download the sample file. Upload files to obtain results.
(3) After successful operation, a history record will be generated. Click the link to view the results directly.
(4) View the synteny map between species chromosomes. Click on a line segment to view specific genes, and click on the right chromosome to mask it.
(5) Click on a point in the species synteny gene map to view specific gene information.
(6) View species synteny gene pairs, including gene ID, evaluation value, and bit score value.

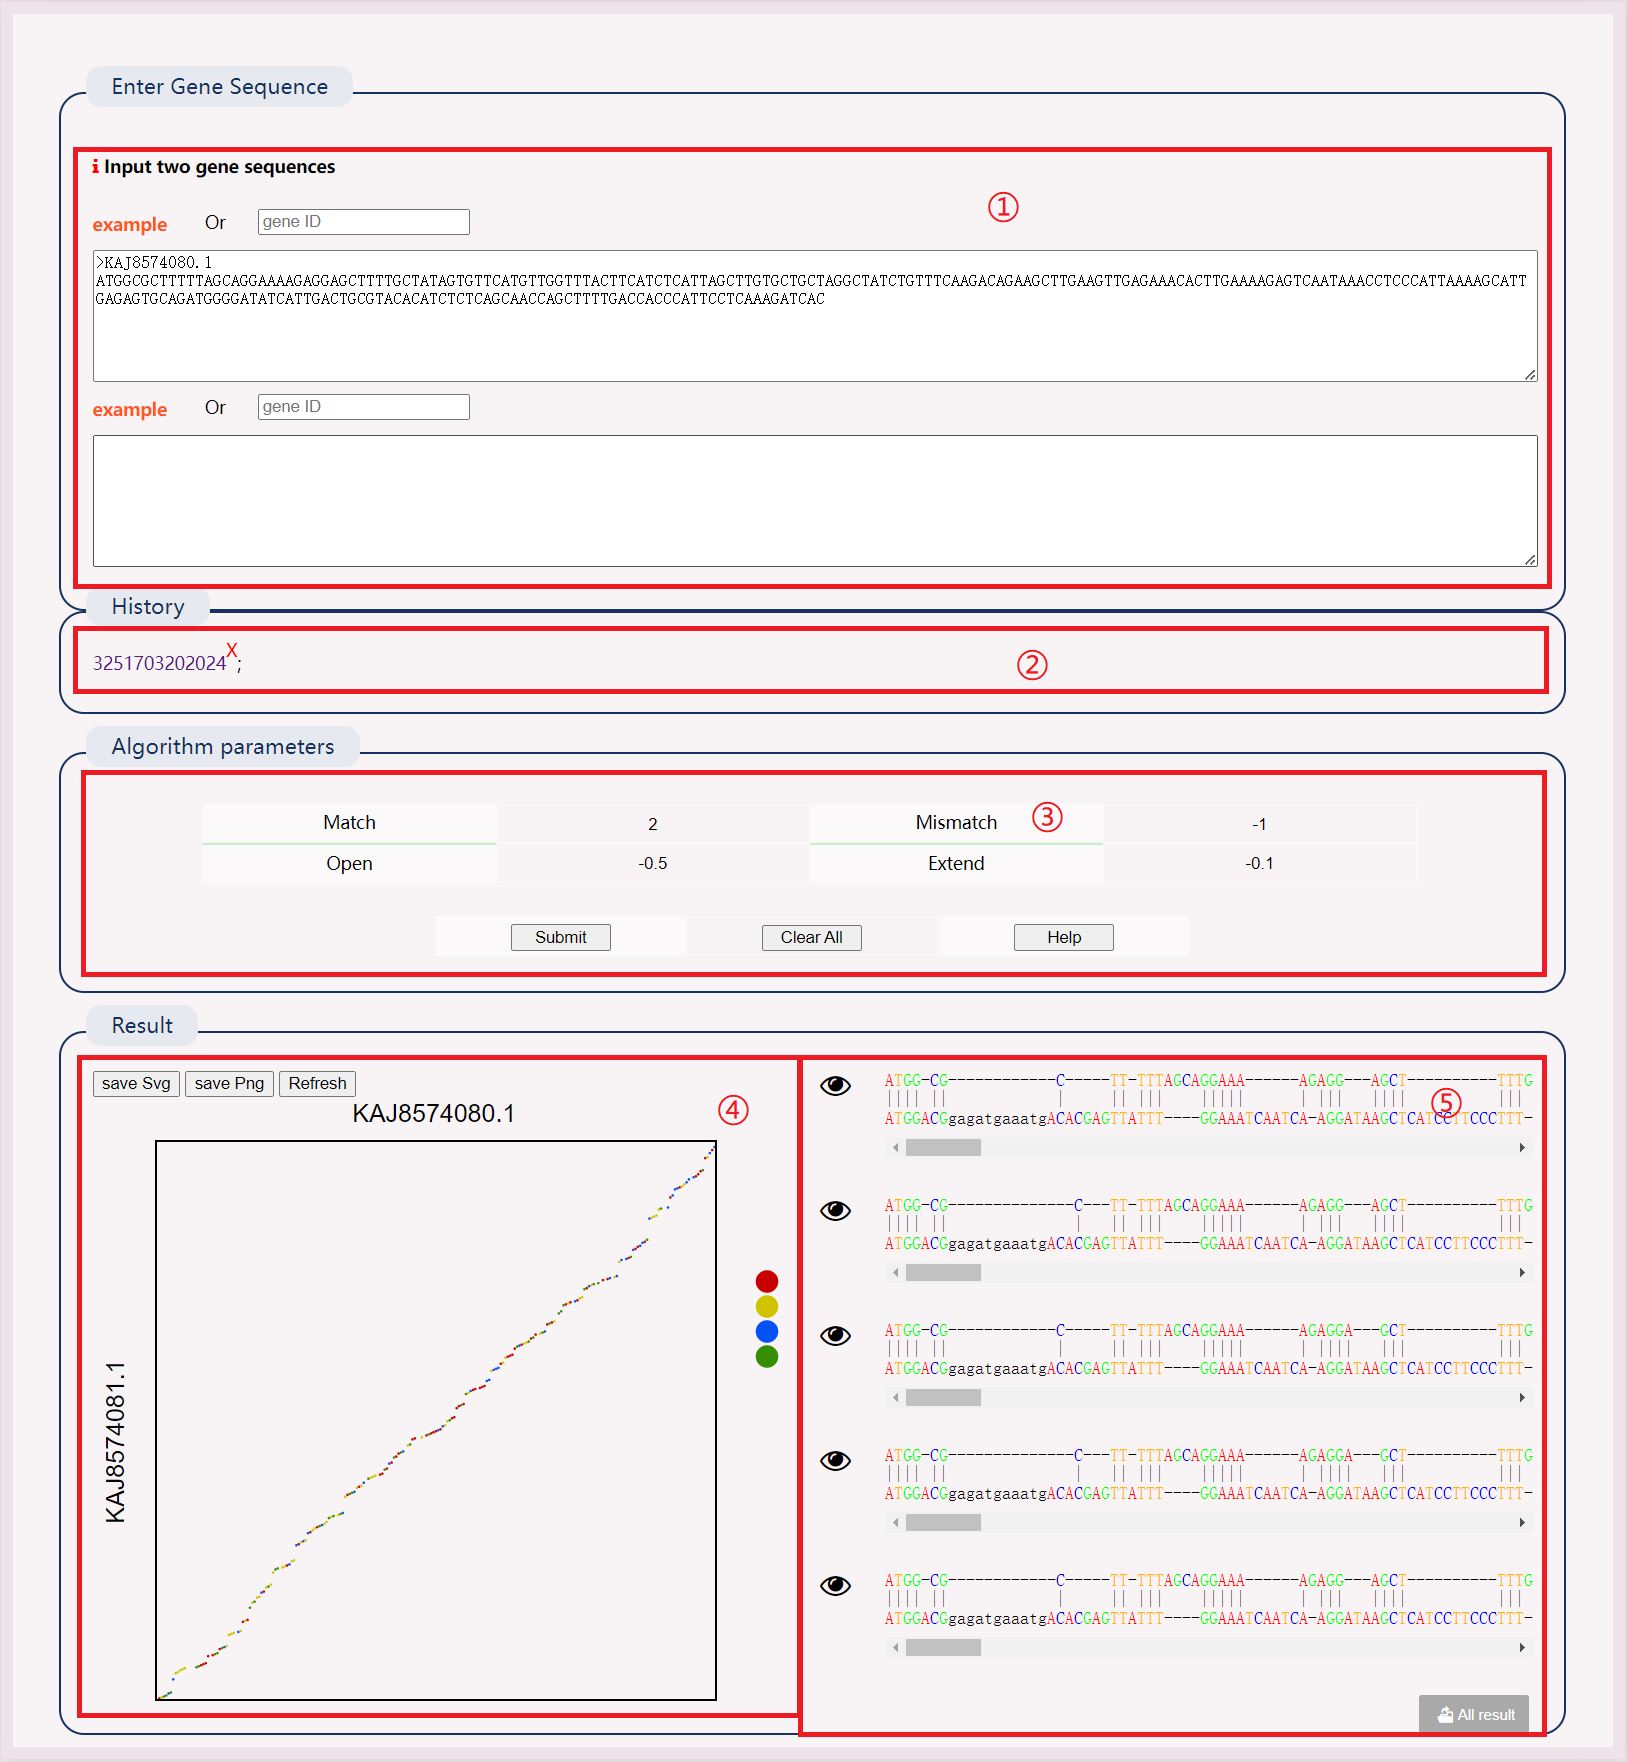
(1) Click on the example or upload the file.
(2) After successful operation, a history record will be generated. Clicking the link to view the results directly.
(3) Select appropriate parameters.
(4) Results include: Product size, F_primer, F_TM, F_FC, F_Stability and R_primer, R_TM, R_FC, R_Stability.
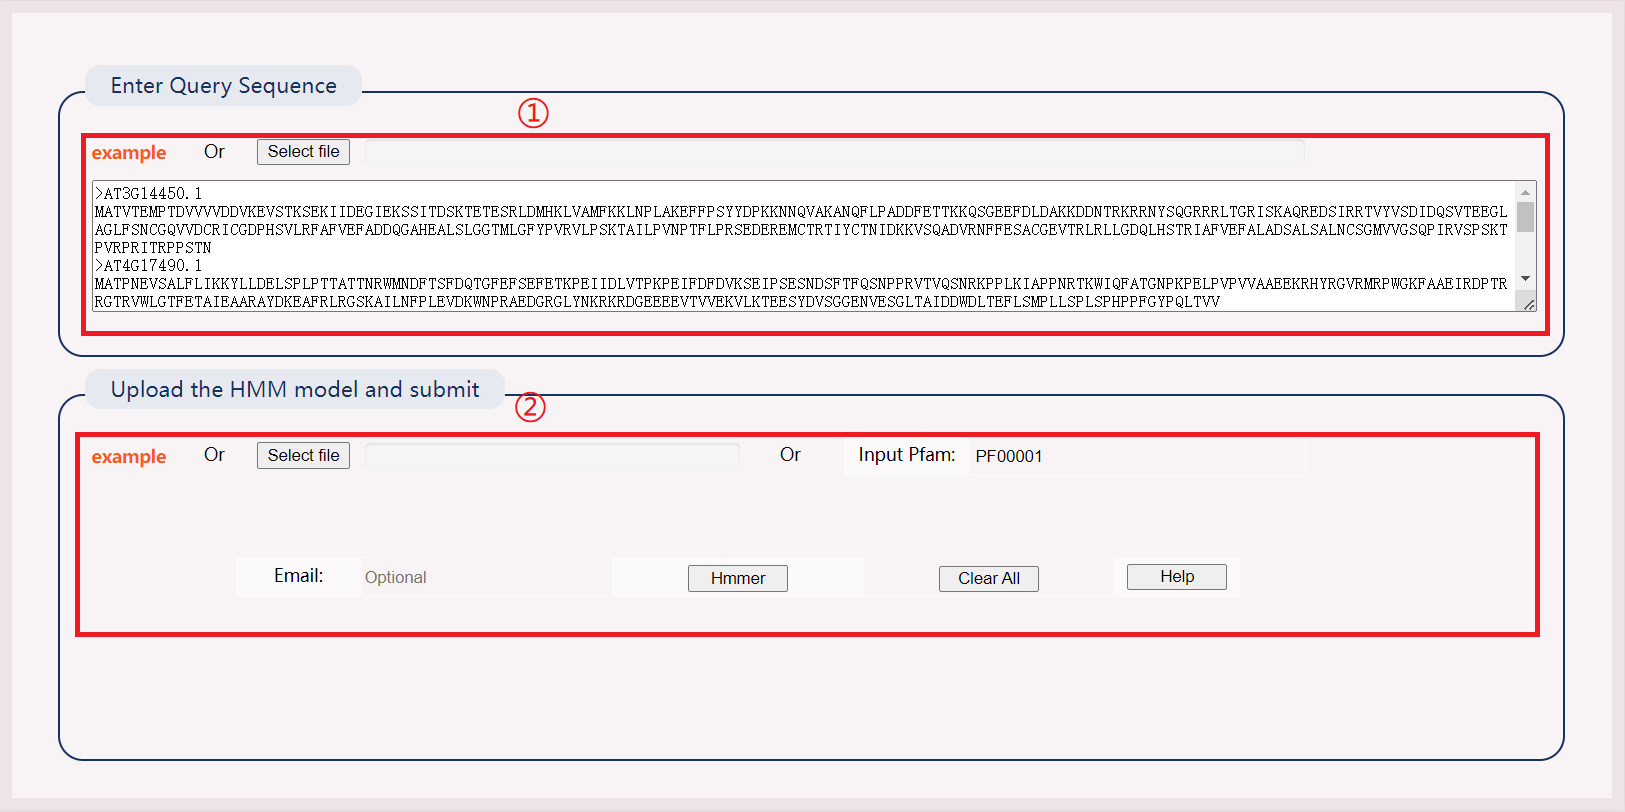
(1) Enter an example file or submit a sequence file.
(2) Select online models or submit your own models. Results will be downloaded directly as files.
Declaration
Some pictures and data of this website are sourced from the Internet and other public database platforms. Copyright belongs to the original authors. If there is any infringement, please contact Xiaoming Song () for timely deletion. All data in this database is free for all scientists to use. For commercial use, please contact us for authorization.